The ONS web roadmap
aka – the one where I talk about road maps
Roadmaps are good. Public roadmaps are better and public roadmaps where we talk about how they evolve as we go along are the very best of all.
This should be the permanent link to our roadmap. We don’t have an internal version of this, so (and this is a little scary for me) we are continuing to do all of this in the open.
The themes are at a very high level with more detail where we have it, but I think they begin to show the scale of the challenges we are looking to address.
Essentially, we are looking to improve the performance, security and scalability of our platform whilst iterating the audience-facing web experience and adding in the support for local area and multivariate data.
This last point is key. It is our top priority for the year and it means we hope to quickly move from offering the static serving of bulletins and compendia to a geographically personal offering that means the information provided can be put in a much more meaningful context for each user (it also means our caching model will break, our file storage system needs to be swapped to a database and the way we deploy code all needs to change before we can really start any of it).
Alongside this, we are looking to iterate key components of the service experience and try and be even more open in what we do.
Some highlights that we are looking at in the short term.
Meta, Metadata
As part of the GDS Service Standard (which we choose to follow) we need to provide public performance data. One of the challenges we have faced with this, is that this performance data is easier to articulate for a transactional website (how many people signed up for X, how many people downloaded Y), which is not how we are set up. We are exploring some options around this and I hope the team will be showcasing some really interesting thinking around this (and a working dashboard) very soon.
Charts
Our audience loves a time series chart. This much we know. We are also choosing to invest time in significantly improving our chart experience. Key areas of focus are around better support across device and the simple need to support more chart types.
Work on our API
Our website is our API, but unless you built our website, our API can be a little tricky to understand. To try and help with this, we are going to develop some much more substantial support around the API and include sample applications and code libraries to help ensure people are more able to use our information in the ways they wish.
As you can see, the roadmap is pretty full. This is an essential component of the work we have in defining a service. Continuing to iterate at pace to continually seek to better meet the needs of our users.

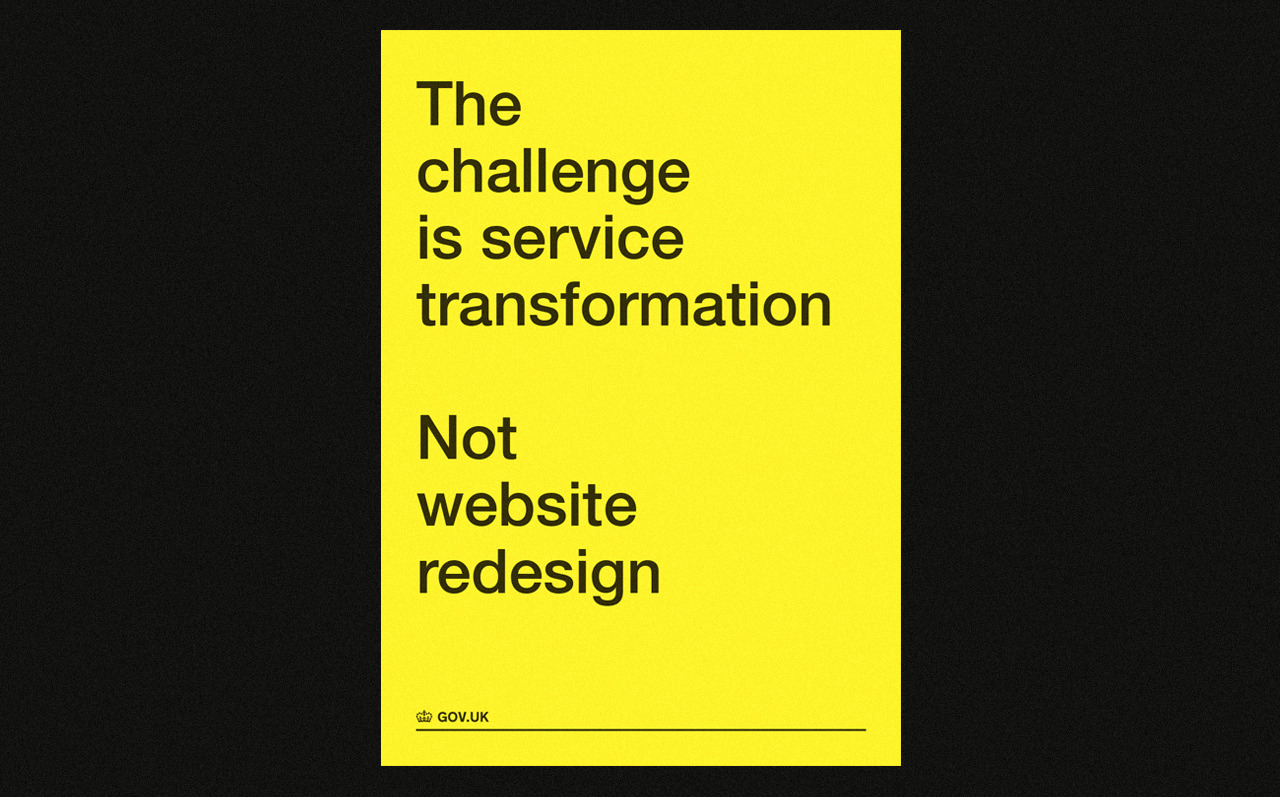
the challenge is service transformation
We have bold ambitions to update the way we present content, inform the users we are aiming that content at and consolidate the overall experience of interacting with our outputs online. It is going to be a busy few months, but please do ask me questions and let us know your feedback.
3 comments on “The ONS web roadmap”
Comments are closed.