Sprintnote: 4-17 Jan 2017
Our first sprint of 2017 saw us hit a really important milestone with the Data Discovery Alpha. As mentioned in previous posts we have been aiming to get a ‘thin slice’ up and running to prove the concept of what we are doing and give us a base to build upon. In this case the slice we have been aiming for takes us from loading a CSV file (containing the stats) through to making a selection from the dataset dimensions on the website and downloading this customised data.
With this in mind, getting the remaining components built and working and joining them up with the existing parts was the focus for the last sprint. After a fantastic effort from the team I am pleased to say we were able to demo this whole slice in our last show and tell. It is worth mentioning that this demo was not done on localhost, but on an environment mirroring production. This is a great point to get to and it is awesome to see all the various components up and running and talking to each other.
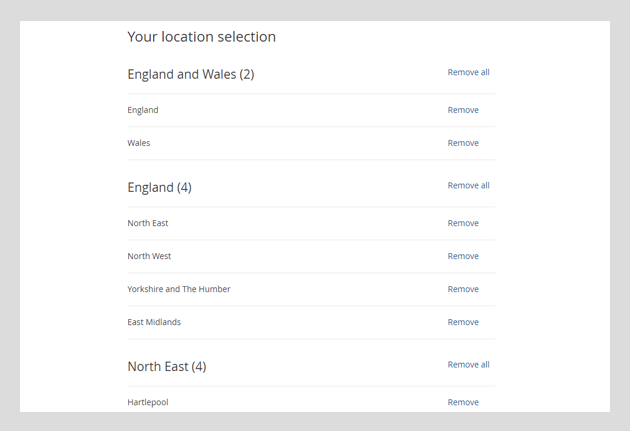
This sprint also saw us build out a working HTML prototype to test our thinking around how users can select the geographic areas they are interested in from a dataset. This has been one of the really difficult areas on the UX side of things and has led to the phrase ‘geography is hard’ being used quite a lot in discussions. We have already been through a few iterations with this, making the most of InVision to get our thoughts in front of users quickly before we invested more time in building something out. There is still potentially more to do here and we are keen to see how these designs hold up when the complexity of the task increases, but the initial take from the first round of testing last Thursday seem really positive.
So what’s next in data discovery? There is still quite a big list and lots more to explore in this Alpha. In the current sprint we are looking to extend this ‘thin slice’ out with more data and the big focus will be exploring how we can get users to the dataset they need by improving search and navigation, utilising the new metadata we store.
Search
The live website has not been forgotten in all this and this sprint has seen the first of a series of enhancements to search go into production. We have been working to review the current implementation and fix some issues highlighted where the current search produces poor or incorrect results.
We have updated the way our synonyms and stemming works and also added in the ability for us to exclude words from this stemming where these were causing problems. For example we found ‘productivity’ and ‘production’ searches were the same due to both being stemmed to ‘product’. Getting real examples of searches like this that are not working is always really helpful so if you spot any oddities please let us know.
Charting
Work has also begun to improve and extend chartbuilder, used in our written publications. We have a lot we want to do in this area, with charts such an important component of these publications. This first iteration is focused on giving more direct control over the detail of how these charts are presented and new functionality such as the ability to add annotations. We are looking to get this across to our publishing team to test out shortly and into production as soon as possible.
If you have any thoughts or comments on any part of the website please do let us know in the comments on this blog post or on Twitter to @ONSdigital