Optimising social media content
Here at ONS we’ve got insight into our users from research and an understanding from web analytics about what’s hot on the website. But what we didn’t have, until now, was clarity on what kind of message drove the most traffic or time spent on site. Knowing this should allow us to optimise future messaging.
Background
Back in February, I ran a series of events at work on ‘writing social media@ONS‘, the first of which Mark Frankel, Head of Social News at the BBC, kindly came to present as did Catherine Toole, CEO of Associated Press’ Sticky Content. The objective was to bring statisticians and the off-line media team – who draft our social content – around to the idea of writing with a user segment in mind as well as the content’s likely performance. A significant piece of each session was the idea of using a healthy mix of copy formats (listed below) and the hypothesis that different formats would see different responses from our users (an idea that’s discussed a lot in digital circles):
- Headline. Subject, number and link. No messing about. Example
- Nugget. Did you know? (without asking it). Example
- Draws you in. Makes users *want* to click as the content’s so profound, emotional or sticky. Example
In addition to copy formats, it’s assumed that images and interactives have a positive effect so the increase of infographics and data visualisations being produced here should help on that front.
How we did it
We use HootSuite to publish our social content and Webtrends on the web analytics side of things. The two can work together so each link we publish can be tagged with set parameters and values within each parameter.
- Parameter 1 = taxonomy / subject and values within are i) econ, ii) pop, iii) lab, iv) bus, v) corp
- Parameter 2 = format and values within are i) headline, ii) nugget iii) draws you in
- Parameter 3 = content and values within i) image, ii) interactive iii) post (to be used when the other 2 don’t apply)
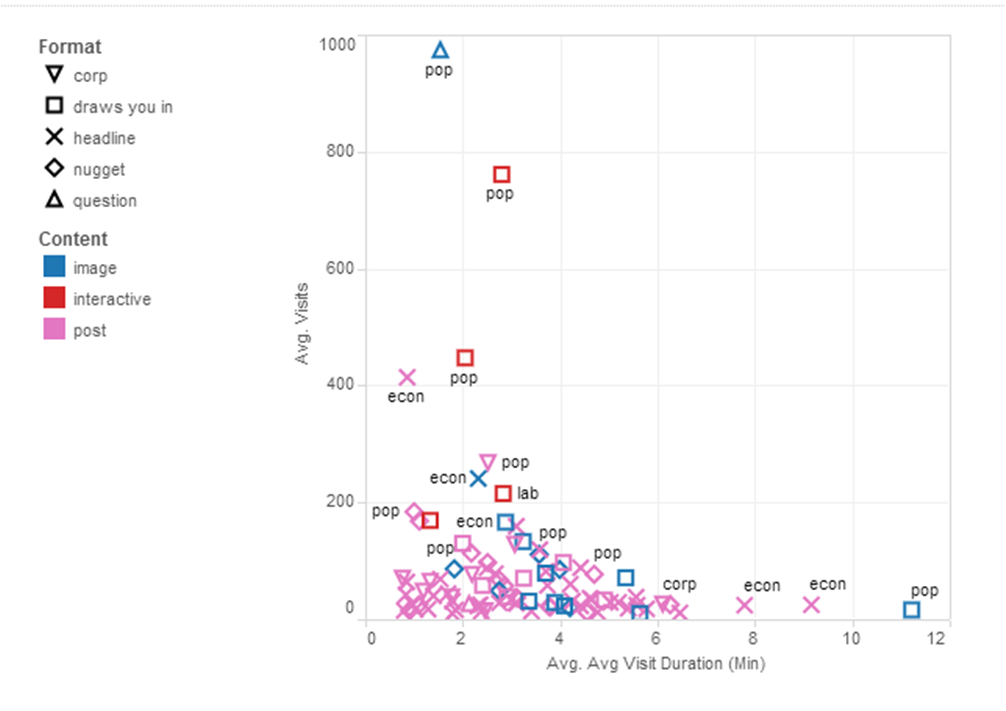
HootSuite also works with Google Analytics in the same way and like with ours, that data can be pulled from an API, which Rob in our Data Vis team put into this scatter graph on Tableau Public.
What it shows Very broadly…
- Enticing copy sees better engagement on site
- Images help a post’s performance
- Interactives help even more so
By all means play around with this, and turn filters on or off by clicking on the values on the top left. Apologies it’s not too intuitive, but this is a quick and dirty prototype after all. Massive caveats This stuff is all well and good but there are some massive caveats I should share / would keen to hear your thoughts on:
- This visualisation doesn’t represent engagement in our content off site. It’s a big ask to interrupt someone flicking through their social feed, to come to our site and spend time there. So shares and chatter around a subject could be high even if visits to or time spent on the website is nothing special.
- This visualisation doesn’t take in to account bounce rate. On from the point above, it’s a big ask to expect a user to consume content on our website when it doesn’t optimise for mobile which the lion share of visitors to our site from social are on.
- Because of point 2, we’re very careful to make sure the reason someone clicks on one of our links is answered or very clear when they land on the site. Sometimes the destination is deep within the site where various pages on the same subject are organised into sections with ‘#sectiontitle’ at the end of the URL. Like this. This Webtrends / HootSuite mash up doesn’t like them, so what you see in the tableau is a fraction of what could be there.
Wrap up This has been a useful exercise to back up the copy formats introduced back in February at the writing for social media @ONS sessions. I think we should continue for a month or so to get a little more data and try to address some of the caveats above. After then though, we should draw a line under it. As we’re not selling products, we don’t need to labour over every word for optimum response, splitting hairs to get a few more visitors from social when in the grand scheme of things search engine optimisation (SEO) will have much more impact on pushing numbers up. All said and done though, it’s important we continue to have a mix of content with or without images told through different copy formats, so as not to dilute messaging when it really needs pushing. Andrew Clark

2 comments on “Optimising social media content”
Comments are closed.