The Graphical Web 2014: How Was It For You?
Over the last few days, ONS Digital staff have been busy running The Graphical Web 2014: Visual Storytelling at the University of Winchester. I wrote briefly before the event about my pre-conference expectations and reasons for hosting – here’s some follow-up thoughts about how the event itself unfolded.
Firstly, the numbers. We had 165 delegates from 15 countries as far away as the USA, Australia, Japan and Mexico – which genuinely gave it a global feel. Over 4 days, the conference had 5 keynotes, 2 panel sessions and 3 parallel presentation tracks, together with 8 workshops. Size-wise, I thought this worked out well, because it was small enough to feel intimate but large enough for there to be a buzz about what was going on in other tracks etc. Luckily, our superb volunteer team from the Winchester School of Journalism have captured the vast majority of the content with multi-camera feeds, so delegates (and in fact, everyone) will be able to revisit their favourite talks and see the ones they didn’t manage to make it to: We’ll post the video, along with links to presentation slides on the conference website shortly. By way of a visual scrapbook, we’ve also created a conference flickr steam.
For many delegates, these kind of events are a great way to network with luminaries who they may previously only have known via Twitter – for example, Scott Murray, Lynn Cherny, Robert Kosara, Jaume Sanchez Elias all travelled a long way to Winchester and I know there are a lot of people happy that they did so.
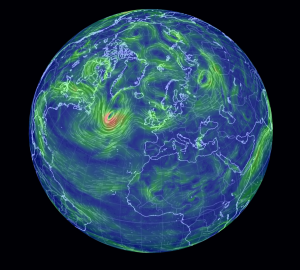
Personal highlights included Cameron Beccario’s amazing and inspirational keynote talk about how he created The Wind Map. As well as being an amazing site, the story behind its development, together with Cameron’s humorous and modest delivery made it a standout talk. Mass spontaneous applause half way through your presentation is usually a good indicator that you’ve done something special…
Jason Davies’ Geometric Madness was jaw-dropping in its complexity. Most delegates appreciated the subtle humour of Jason describing some of the work he presented as ‘quite difficult’ to create – the viral rumour that the GeoJSON file format was named in his honour deserves to spread…
The BBC Visual Journalism team led by Amanda Farnsworth also deserve special mention for contributing so much – a keynote, 2 workshops and a panellist was a great effort. A memorable finale to the last keynote from Amanda was ‘close-up’ footage of a cat vomiting as part of the Malofiej-gold-winning ‘Secret Life of Cats‘ interactive. That being said, the program was full of so many truly amazing talks that I am sure delegates will go home with many memories.
One persistent theme for comments throughout out the conference was that the wide ranging audience of web standards/implementors/web programmers/data viz/statistics/journalist – types made for some genuinely interesting discussions both during and inbetween sessions. People had enough in common to find things to talk about, and sufficient differences to generate lots of well-mannered debate/arguments. We’ll aim to post some more follow-up articles focussing on specific thoughts and reflections from some of the talks – there were far too many gems to cover them all in this short post.
The social event also worked well – I’m thankful to the delegates from the Met Office for arranging for the rain to stop and the sun to shine long enough for us to sail around Portsmouth Harbour and see HMS Illustrious being decommissioned, before settling for drinks and dinner on ‘HTML’ Warrior.
Finally, there are so many people to say thank you to for helping us to make the event a success that I can only be brief here: The volunteers at Winchester led by John Wilson, along with the Winchester conference team, my geographically-distributed colleagues on the main conference organising committee, our many sponsors and supporters (including W3C), Portsmouth Historic Dockyard, ONS Digital staff, the presenters, keynotes and workshop instructors. Sally Oatley at ONS deserves special mention for organising disorganised people (me) and taking a firm line with coach companies who phone up an hour before the social event with news that one of their coaches had broken down. Phew, it takes a lot of collective goodwill to make these kind of events work.
But that’s enough from me – I’d be interested in hearing more feedback from delegates, either via Twitter (#tgw2014) or as a response to this post. Please share your thoughts as it will help us to make next year’s event even better! For 2015, the conference heads across the North Atlantic to Pittsburgh, PA. , in the safe hands of Dr David Dailey and his colleagues from Slippery Rock University. If you want to be a part of the organising committee, contact the conference team info[at]graphicalweb[dot]org . Otherwise, follow the build up on www.graphicalweb.org – and see you there!


One comment on “The Graphical Web 2014: How Was It For You?”
Comments are closed.