Content in Context
On Friday 13 February 2015, the Social Media team shared the Census Singles interactive before Valentine’s Day.
The post was published at 7am to test whether we are in any way missing the morning breakfast and commuter audience given our usual publication time of 9:30am.
We shared the interactive twice on Friday 13 February – at 7am and again at 5:30pm and the engagements stats were promising.
7am
There were 1,033 engagements for this post, and nearly 10,200 total impressions.
These engagements included:
Retweets: 43
Replies: 7
Favourites: 20
Link Clicks: 253
5:30pm
There were nearly 450 engagements for this post, and nearly 7,750 total impressions.
These engagements included:
Retweets: 19
Replies: 4
Favourites: 12
Link Clicks: 155
This isn’t the first time we’ve published this interactive (although with some slight change this time around), and it’s interesting to compare the other instances back in March/April 2014 when the interactive was first published.
So how does performance compare across each post?
Context
Key Metrics Overview

In terms of total engagements, evidence seems to suggest that our post tweeting along to the Channel 4 programme “First Dates” was the most popular.
If you take impressions alone, these also suggest that this same post was the widest reaching as well as most engaging.
However when looking at the engagement rate overall, it would seem that Friday’s 7am tweet performed the best.
Engagement rates in this format are confusing sometimes as they perhaps indicate that one post has performed more strongly than another, when there are multiple factors to consider.
In this instance Friday’s 10.19% is calculated by the engagements (1039) divided by impressions (10198) multiplied by 100.
The implication is that the wider the gap between engagements and impressions, the lower the rate will be.
For instance, taking Friday’s post as an example and the following scenario:
– 1 more person retweets the interactive, which is one more engagement, totalling 1040.
– This one person has 100,000 followers, 25,000 of which actually see the tweet – for every person that sees the tweet, this generates another impression. New impressions would now be 10198+25000 = 35198.
– In this instance, said Engagement rate would now be 1040/35198 x 100 = 2.95%. This has now fallen from 10.19% and would suggest that this tweet was now the poorest performing of the 4 when this isn’t the case in isolation.
It’s very likely that in this instance, that out of a number of 25,000 additional users, some would engage, but the example highlights the volatility of the metric as a whole and should be treated carefully.
Breaking down Engagements
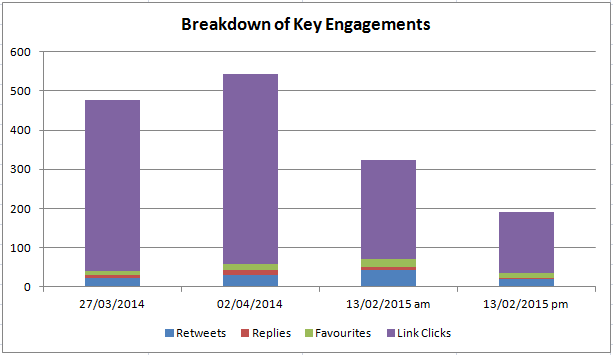
When considering the performance of each post, breaking down the engagements to look at differing user interactions paints a very different picture.
The above chart shows 4 of the key engagement metrics with the greatest totals across posts.
Overwhelmingly in this case, link clicks dominate the volume of engagements.
If we take this metric, it paints a different picture, with our tweet on 02 April to support “First Dates” coming out on top with the most clicks.
The content in this instance is such that it requires users to click through in order to provide an answer to the headline question:
27/03/14

02/04/14

13/02/15 am

13/02/15 pm

In each instance the content is drawing the user in to click through and explore the data. Hence, retweets & favourites are not huge, but clicks are.
A Comparison
If we compare this with the last 4 Labour Market statistical releases, which are headline based and consistently published at 9:30am:

Labour Market Statistics is by far our most popular publication and generates the most debate on Twitter.
Because the social content is usually headline focused, there is a big difference in the breakdown.

Retweets in most cases now take the majority of the engagement. Impressions are considerably higher – particularly in November and December – as illustrated above.
The greater number of retweets is likely to have been responsible for this.
Engagement rates in this instance are very low, bottoming out at 0.29%. This is despite strong click and retweet rates and decent engagements overall.
Time & Messaging
The Labour Market publications show that there is perhaps an expectation from our users that we tweet at 9:30 and they know that the data will be available at that time.
This can be seen in the consistency of engagement, coupled with the popularity and emotional aspects of the content.
The Interactive on the other hand, has been published at a number of different times and in different scenarios.
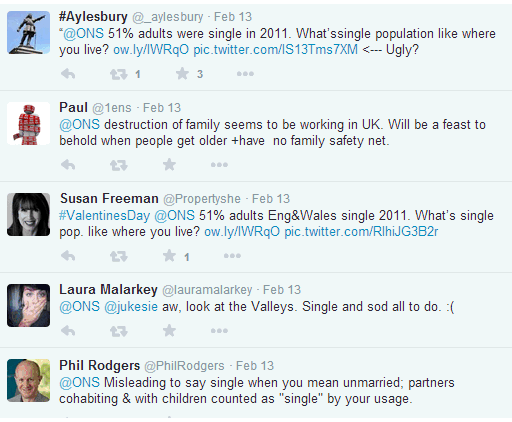
The initial publications on 27/03/14 and 02/04/14 performed best in terms of overall engagements. However looking at the qualitative feedback, the messaging may have drawn engagement in the form of mixed feedback on the map and its purpose.
Our Tweet


Tying the interactive in to valentines day worked well and changing the tone of the messaging definitely had a different result, even if it wasn’t all positive.
So all in all the Interactive has seen plenty of interaction during its course so far.
Considering all of the metrics available gives a more detailed performance picture, and allows us to consider the different successes achieved with varied approaches.
One comment on “Content in Context”
Comments are closed.