Tweeting on a Budget
Following the success of tweeting along to the Autumn Statement in December, we decided to do the same again for #Budget2015. With the Social Media team currently one man down and an already busy week for ONS releases, we had our work cut out for us. Budget day happened to fall on our latest release of Labour Market statistics – our busiest day of the month generally!
From the areas discussed at December’s Statement and the build up and coverage beforehand we had a good idea of what topics would come up. We worked with our statisticians and Press Office to look at what performed well last time and built on that, but also used the opportunity to promote additional products such as our data stories on visual.ONS, particularly the UK Perspectives series which looks at longer term trends and presents our data in a simple, digestible format. With 30-odd prepared tweets drafted in advance, and stocked up on sugary snacks we were ready to go.
The volume of mentions saw a similar trend to the Autumn Statement, and #Budget2015 was trending on Twitter the day before, day of and day after, but we saw a bigger scale and prolonged peak this time around.

The feedback from last time was that people appreciated an official voice putting the Statement in context and we received similar comments this time.
https://twitter.com/HG54/status/578178740515139585
Our most popular tweet during the last Statement was an interactive map looking at economic performance across the UK, so with the updated data we promoted this again, and again it was one of our best performing tweets.
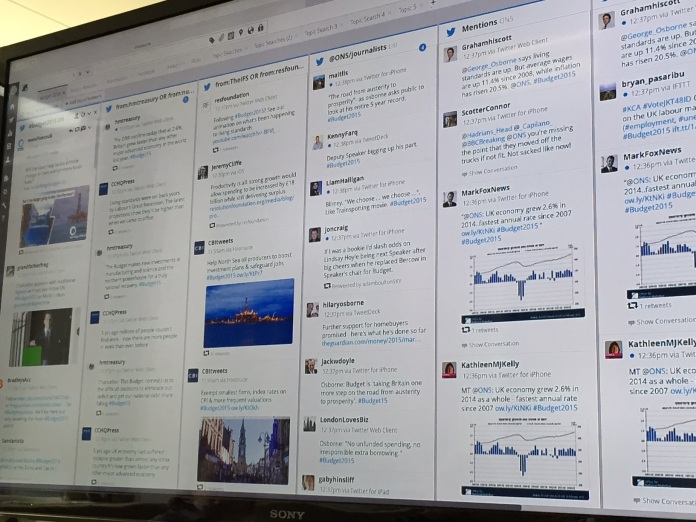
Other highlights included a time series of CPI which was lifted and used by others, an infographic on debt across the EU28 and a chart breaking down the drivers of GDP growth.
When we looked at the web analytics there were noticeable spikes in the content we linked to, particularly the visual.ONS articles and some of the infographics and interactives, which often have the highest clickthrough rates of our Twitter posts, so it was a good boost for existing content that people may have missed the first time around.
We received 932 link clicks overall on the day, 1,133 clicks through to embedded media (attached images) and 775 retweets.
Covering these topical live events is something that’s proven valuable for us and something we’ll look to do again. We’re ideally placed to add value and point people towards the official statistics on the topics being discussed. From monitoring discussions around these events, we find people are continually using us as their ‘trump card’ when proving their source is reliable and unbiased.
Social Media Manager
6 comments on “Tweeting on a Budget”
Comments are closed.