A data literacy scale?
Is is possible to create a data literacy scale modelled on the GDS digital literacy scale? I think it might be, and this blog post details how I think it would work.
How did I get here?
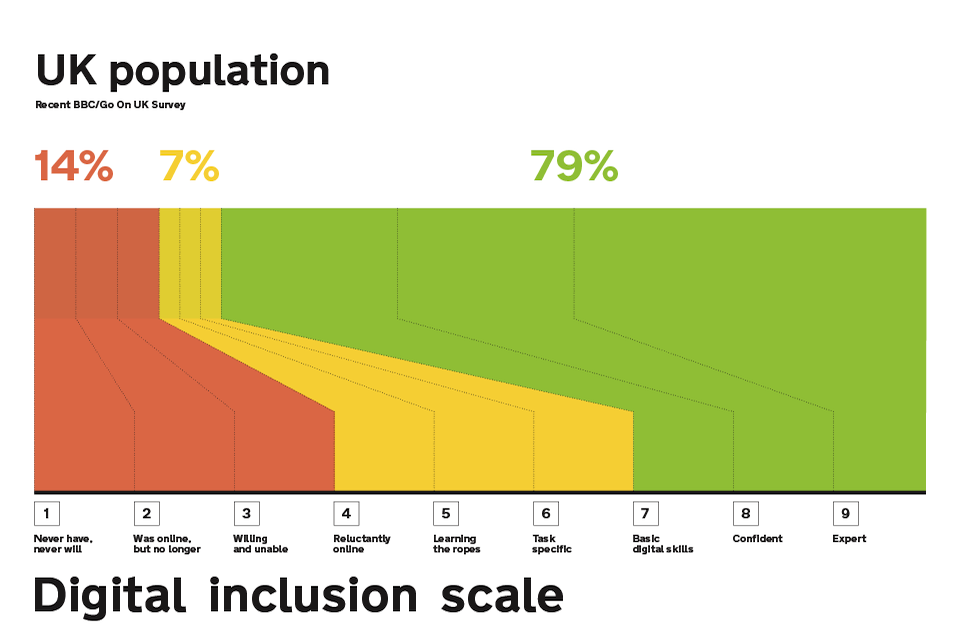
The digital literacy scale was developed by GDS and published as part of the Government Digital Inclusion Strategy in 2014. I found it useful when working with a wide range of government services. It was a good check to see where the gaps in user research existed, and it was a useful tool to use with recruitment agencies. As a member of service standard assessment panels, it was also helpful to use to ask service managers where they thought the users of their service were on the scale, and why.
After returning to ONS almost eighteen months ago, I’ve been involved in researching, testing and creating products for people with a wide range of data skills. I’ve started to wonder whether it would be possible to develop a data literacy scale, using a similar pattern. As with the digital literacy scale, this would provide some broad categories that would allow teams to easily describe where they think users of their products most naturally fit. (Not everyone is going to fit exactly into these, but that’s OK.)
A data literacy scale would also allow teams to identify gaps in testing and categorise findings from research more easily. I’ve spoken to as many people as I can both inside and outside of ONS and I’ve produced a version of what this might look like.
The proposed Matt scale of data literacy (TM)
You can see the original Digital Inclusion Scale above. I’ve gone for six categories in my proposed data literacy scale:
- Beginners
- Readers/explorers
- Makers
- Communicators
- Scientists
- Pioneers
I am, of course, conflating a number of different spheres in these categories. These include:
- data formats;
- statistics and data (not all data is statistical, statistics can be data);
- geospatial issues;
- tools and practices often associated with data science;
- understanding the limitations of data;
- visualisations, graphs, and charts;
- licensing and re-use;
- the reason for using the data in the first place (e.g. policy development).
What next?
I’ll be honest: the spheres listed above are not all areas where I’d claim expertise and I’m not sure that this version is complete enough to use. The problem is that this draft has sat around for six months without me finding any ways of developing it further or anything additional to add to it. In the spirit of working in the open, I’m publishing it for comment in the knowledge that it’s incomplete.
Please help.
In particular, I’d like to know:
- are there any important indicators of data literacy that you feel are missing from the draft?
- is there any part of the draft scale that you feel is wrong or has an unrealistic group of skills? (what would you move left or right?)
- would you use this scale in your work?
- are there any aspects that would make it more usable for you?
- is this too complex an area to allow a broad grouping of trends around skills in this way? (this, too, is useful feedback)
You can let me know what you think by commenting on this blog post, commenting on the google sheet embedded above, or by email at matt.knight@ons.gov.uk or Twitter @mattinwales.
In return, I promise to publish any findings on this blog.