From ONS to ITV – what I learned about data from my election attachment
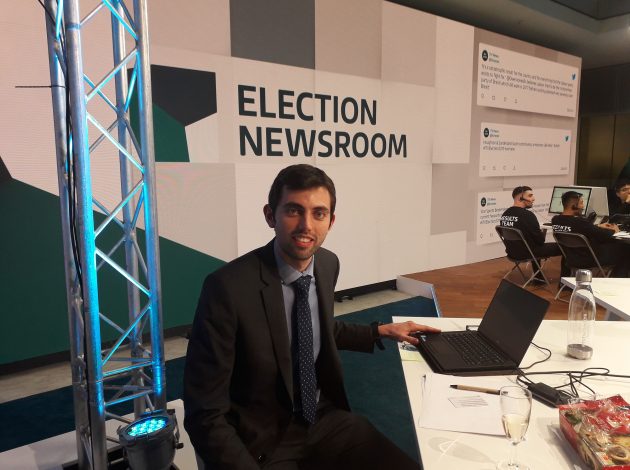
Hello. My name is Phil and I’m a data journalist in the ONS Digital Content team. Before last year’s general election, I spent four weeks with ITV News helping them find and interpret statistics.
As a data journalist charged with communicating statistics to the public, there are few things I find more frustrating than figures being quoted with poetic licence. This is especially common during election periods, of which we’ve had more than our fair share in the last few years!
Happily, the ONS is taking a proactive approach to helping people use our data, which (since 2015) has involved sending statisticians and analysts on loan to work with news teams. The benefits are mutual – news teams gain impartial advice and support from a trusted source, while ONS staff experience a fast-paced environment and see first-hand how the media make use of statistics.
Shortly after the latest election was called, I received an email about the scheme from our Media Relations Office. I applied, and a couple of weeks later found myself walking into ITV News HQ in London.
I was a little apprehensive before going on attachment, and wasn’t sure how much I’d be able to contribute as an outsider – how much do broadcasters rely on data and analysis anyway?
Quite a lot, as it turns out. ITV journalists use data regularly in their reporting, but they aren’t always able to find reliable sources, or manipulate spreadsheets to get what they need.
As soon as I arrived, I was greeted by ITV’s Business and Economics Editor, Joel Hills. Reassuringly, Joel trusted me as an expert and someone able to source data effectively. He needed me to be concise: “Don’t send numbers in a spreadsheet,” he said!
My first day was typical of the experience. The Liberal Democrat manifesto was released with one of their biggest spending pledges on childcare, and I spent an afternoon finding out how many families and children would benefit from it. I summarised relevant findings from an ONS release on families in the labour market and provided data on the rationale behind policies such as free childcare and extra paternity leave.
The attachment continued in that vein – I spent a lot of my time researching election pledges each day, assessing their credibility and their rationale with data.
I was fortunate to do much more than just research during my time with ITV. I spent one afternoon on the phone with small businesses, trying to secure an interview for the evening news. Another night, I attended an election analysis event hosted by the Institute for Fiscal Studies (IFS). I even travelled to Rotherham and Doncaster for a piece about immigration in local areas.
On election night, I was in the newsroom alongside ITV’s biggest reporters, and some famous political names. As Joel delivered his report on the market’s reaction to the exit poll, I was in the background monitoring exchange rate movements.
It was a fantastic experience and, most importantly, I took a few things away to apply, or at least remember, in my day job:
1: Statistics (and the people who use them) are important
Data are essential for day-to-day reporting, whether it’s in the papers, online or on TV. I was pleasantly surprised by how often Joel referred to statistics, and how he trusted the people who work with them. As a measure of the trust he placed in me, he asked for a data-driven briefing on UK and global carbon emissions ahead of the World Economic Forum in Davos (which took place last week). It was clear to me how much data matter in his job.
2: Data sit behind every human story
TV, perhaps more than any other news medium, is reliant on real people and their faces to bring stories to life. But it didn’t matter what we were working on each day – statistics were always relevant. People’s stories were so much more powerful with data providing evidence or a wider context behind them.
3: When used sparingly, numbers make a big impact
In my team at the ONS, we often refer our statistical colleagues to data on the UK’s numeracy levels (they may surprise you). Numbers can be difficult to interpret in isolation, never mind when surrounded by others. As Joel had at most a couple of minutes to cover an entire issue on TV, the most straightforward number was generally the right one.
4: A story often starts with a single question
Joel always asked me direct, specific questions. These led to follow-ups, and a story would mushroom from there. I found this to be a really effective way of exploring and understanding an issue. At the ONS, we tend to start with a broad topic and then narrow it down. Now, I’m increasingly looking to do it the other way around.
I’ve shared a couple of documents I pulled together for broadcasters and producers at ITV. One covers the impact of immigration in Boston, while the other is a longer briefing on CO2 emissions and climate change.
There were six ONS staff placed at news outlets. Read about all of our experiences here.