Twitter at 100k
This past week, the @ONS account reached the landmark of 100,000 followers on Twitter. It doesn’t seem so long ago that we passed the 50k mark and, upon investigation, there are some interesting things we can point to that appear to have accelerated our growth over the past 12 months.
Timeline
The ONS Twitter account was opened in November 2010, and we started collecting follower data in May 2011.
Here’s our progress over the last 3 years:

In terms of “landmarks”, we hit 25,000 in March 2013, around 2.5 years from the account being open, 50,000 then on 24th February 2014 – doubling in 11 months – and then the 100,000 on Monday 02 February 2015 – doubling again in 11 months but this time by 50,000 followers.
The graph shows that followers per month have increased significantly at two key points – September 2012 and September 2014, where followers went up on average by over 300% and 250% respectively per month for the period.
So what has caused the change in growth?
In 2012
The rise in 2012 can be traced back to 25 October when ONS published the Preliminary Estimate of GDP for Q3 2012. Our historical Brandwatch data seems to support this suggestion as the following ONS activity chart shows the highest peak of activity in 2012 on this day.

There seem to be two key events in this quarter that resulted in such interest…
1. “Britain is now officially out of recession”
Mentions related to this and other “economic growth” terms totalled approximately 2500.
2. The “Olympic effect”
Olympic related mentions totalled approximately 600.
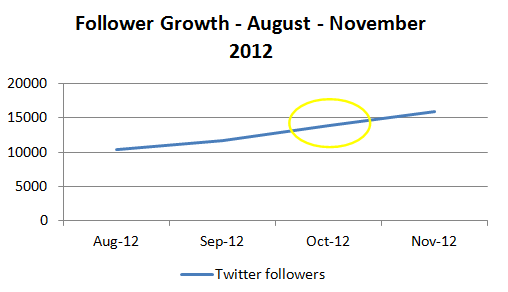
Zooming in on our growth chart, we can see the change in slope of the line between September and October 2012, corresponding with our October peak, and then maintaining the growth in to November.
In 2014
Over the last 5 months we have averaged around 7200 new followers every month, compared with 1800 in the same 5 months a year ago – so what triggered this increase and what caused such a sudden rise?

The sudden change of growth pace in September 2014 can be attributed to 2 weeks between 25 August 2014 and 05 September, where we averaged 100 new followers a day to around 250 following this period.
A key day in this period was 3rd September 2014 where ONS announced revisions to the GDP growth and Balance of Payments.
Our headline tweet on this day….
…was retweeted by 48 accounts, which was seen by a total of 91,500 people on Twitter. Whilst not necessarily the most visually appealing piece of content we’ve posted, it was a change that many economic commentators were anticipating and gained a lot of interest.
High impressions indicate that the tweet was shared by followers who have a large number of followers in their own circles.
Looking at which accounts shared the website article link, the most prominent account to retweet and share the link was the UK Prime Minister (@Number10Gov) account.

With nearly 3 million followers and content that averages nearly 90 retweets per post, it’s likely that this share contributed significantly to the surge in followers that we saw. Such a high profile UK Government account is also more likely to have a greater percentage of “active” followers, who, if they follow us directly are more likely to engage with our content as a result.
It was from this date that followers began to consistently grow at around 7500 a month, with the growth rate having begun to increase since August 26th.
Mentions activity again suggests a similar trend, with a peak on 3rd September corresponding with the increased follower growth rate.

So a week on from hitting the 100, growth shows no signs of slowing. The first week of January saw a growth of nearly 1650 followers, and the first week of February has seen 1860 new followers. This is despite a quiet content schedule.
A comparison against a similar organisation – The Australian Bureau of Statistics – highlights just how accelerated growth has been.

The ABS has always been growing at a steady pace since this data became available on 01 May 2013. @ONS began this period with 20,000 more followers, and now has 80,000 more followers.
The ABS approach on Twitter is very different to that of ONS – they mainly tweet titles of releases and a link to them, in comparison to the ONS account which has experimented with a number of copy formats over the last 3 years. The concise, front loaded, headline and visual format seems to have paid dividends.
However it has to be said the ABS Facebook approach of headlines and graphics has drawn much greater success.
Our visual content has definitely played a significant part in the reaching of 100k so quickly but away from this the impact of big economic stories on our Twitter follower base cannot be understated.
2 comments on “Twitter at 100k”
Comments are closed.