Publishing with style
Publishing with style
In February we launched our new editorial standards for writing about statistics: Style.ONS. This was a large project based on collaborative work between ourselves and the folks at the Government Digital Service (GDS). The goal was to set out a definitive guide for statistical content across the GSS, based on research and editorial best practice to make sure commentary was as accessible and understandable as possible. So far we’ve had over 3500 users accessing the website and have received lots of constructive feedback. So, how did we get to the Style.ONS you see today, and what does its future hold?
Writing the new standards
We’ve been working on the new standards for over a year and a half. The project kicked off because we’d recognised that the standards were out of date, inconsistent, difficult to use and designed for print publications. We’d also received requests for guidance that weren’t included in the existing standards, such as making infographics. We knew that we needed to go back to the drawing board, creating a brand new set of standards that had research and best practice as their foundation.
Whilst we were working together to develop the statistical release calendar for GOV.UK we discussed with GDS how they could set standards for this. It seemed clear that working together to develop and share new standards would be the best way to help maintain a consistent style for statistical content, regardless of where it’s published.
There’s a lot more to write on how we reached these standards, so expect another blog post soon covering the content of Style.ONS in more detail.
Choosing our publishing platform
Our previous style guide was published on our Intranet (though even older paper versions are still seen on some desks!), which resulted in a few problems that our users regularly fed back to us. The guide was:
- difficult to find
- complicated to navigate through
- not accessible off the ONS network
To add to this we had some of our own requirements which we knew needed to be considered. These were that it:
- must be easy to update content
- allows for iterative development and improvement
- can be built without a dedicated developer team
We considered a range of possible options for publishing: our own website, on GOV.UK, as a PDF or a custom-built product. In the end we decided on using our existing WordPress account with dxw (used for Visual.ONS) to set up a new WordPress site. We then added the customisable theme Canvas, which gave us the flexibility to give it the feel and functionality we needed. It not only ticked a lot of the boxes from our requirements, but could be set up quickly and easily.
What’s next?
There’s no sitting back and resting now Style.ONS is live – this is when the work really starts! There’ll always be more feedback from users, new research and a developing understanding of how our users read and use our statistics. All of these will be taken into account in the style guide, which will be updated when necessary.
Within the first few weeks of going live we’d received a huge amount of feedback from a wide range of users within ONS, across government and outside government. We analysed all of this feedback to help find common issues or themes that we needed to investigate. There were 2 topics that stood out:
- how we will display recent updates to the style guide
- how users can access the guide offline
We’ve since launched solutions for both, so we’re eager to hear whether they’re meeting our users’ needs.
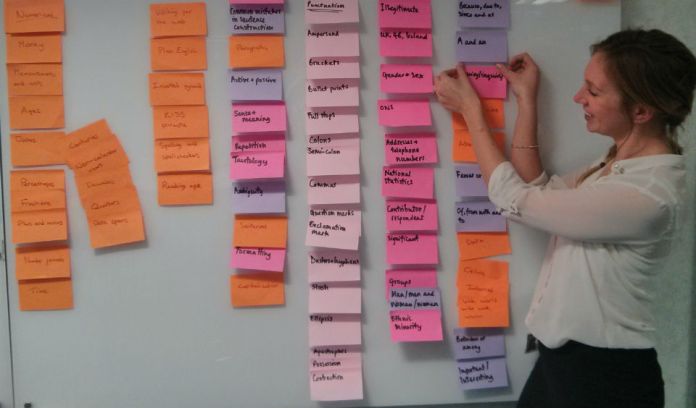
We’re also conducting tree tests and card sorting exercises to see how we can make the website easier to navigate. We used the initial results to make some big improvements before we went live. Results from the current wave of research have shown some parts of the taxonomy that are still confusing users. So, our next job will be to make some changes to the structure and re-test to see if these changes have made it better. If so, we’ll be rolling these changes to the live site. The card sorting exercise is still open, so if you’d like to take part we’re always looking for more data to work with.
We also have our final 2 phases of the style guide left to launch. The first will focus on charts and tables, while the second will cover interactive data visualisations and infographics. We’re hoping to be able to launch both of these sections this month, and will make sure everyone’s informed as soon as they’re live.
If you haven’t done so already, please have a browse through Style.ONS and of course, give us your feedback!
2 comments on “Publishing with style”
Comments are closed.


I still have my copy of that House Style Guide from your picture, and the one it replaced! I refer to it from time to time too. 🙂