Something to prove..
Back in the ‘lull’ between the Alpha and Beta projects for the new website Laura and I were lucky enough to spend a few hours with Tom Loosemore and Jamie Arnold, then of GDS now both at Co-op Digital, work-shopping a visual approach to a roadmap for the project.
It was a useful exercise and while we didn’t use the finished article quite as proactively as I think we envisaged having it front and centre on the wall was always useful and a handy prop for discussions with Programme Board members etc.
One of the most useful aspects Jamie introduced us to was the idea that we should articulate what we were trying to ‘prove’ by the project not just what we were going to ‘do’.
These were high level, long term aspirations but as the site has been live for several weeks now it seemed like a good time to revisit them.
We were trying to prove that we could →
..have a site that can meet the ‘Service Standard’
This was a bit of a do or die aspiration to be honest! If we didn’t pass the Service Standard assessment(s) the project would have been in real trouble. As a team though we were consistently looking to the Standard and the Service Manual for guidance and were always completely committed to the underlying principles of being user focused and developing a sustainable team capable of improving the product in an iterative manner. In the end we passed both the internal assessment and the GDS Beta →Live session.
..make statistics easier to communicate and share
I think this was a little bit too ephemeral to nail down whether we proved this. There is definitely evidence that more of our charts and tables are being shared on social media and there is some anecdotal evidence that the simpler, more hackable URLs are also proving popular. It is early days yet though and we never did build in the tools to directly support social media sharing etc. Adding share options to our charts and something like the Guardian/Medium approach to sharing quotes both seem like interesting options in the future.

..improve search results on Google
Actually part of our ambition here was also not to take a step backwards with our Google position at the time of launch as well. A major site refresh with as many URLs changing as we implemented meant there was a very real chance of that and given 60% or more of our traffic comes from Google that would have been a disaster. Thankfully this didn’t occur and despite some initial hiccups our redirect plan worked pretty smoothly.
To date though it is hard to say how much results have been improved on Google — it will take some time for their index to entirely reflect the new status-quo and some of our ambitions are yet to manifest.
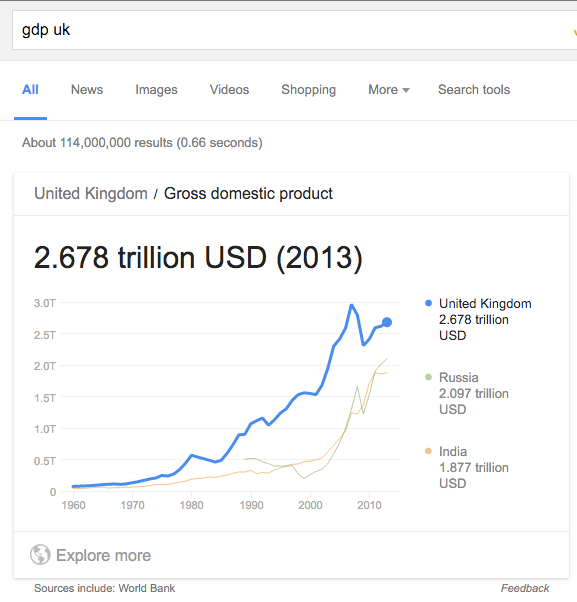
Most significantly the site now uses structured content throughout (add /data to any page to see) and a medium term goal is to enhance this with schema.og to make it more compatible with the Google Knowledge Graph which should improve results and the manner in which they are presented. The longterm goal is for as many straightforward queries as possible to be initially answered via the Google Quick Answers info-box. While this might lessen traffic to us it will greatly improve the user experience — especially on mobile.

..improve site search results by focusing on user feedback
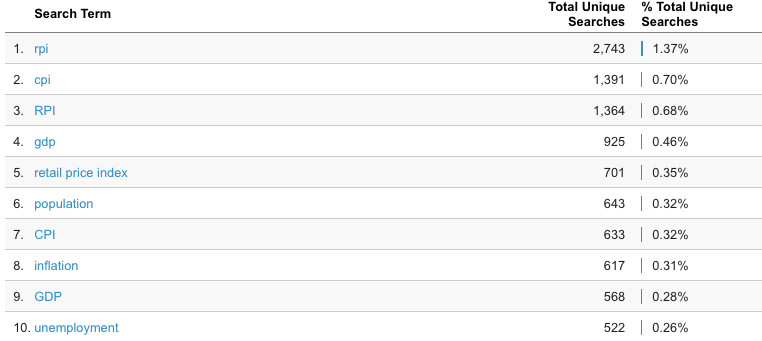
Site search on the ONS website has long been a major issue for our users. To say they found it frustrating would be an understatement — Tim Harford once wrote it was ‘like using Google on an acid trip’. So we have focused hard on this and while it has a long way to go early indications seem to suggest it is on the right path. Constant feedback is the only way to improve it though so as well as encouraging users to let us know of any odd or inconsistent results they see we are also implementing some comprehensive analytics (based on this from GDS) and are looking at other techniques and tools to keep on top of things. This isn’t the kind of job that ever finishes but we are in a much stronger position than ever before to genuinely keep improving things.

..provide a publishing application that was focused on statistical publishing
One of the more controversial decisions we made in the project was to not use an off-the-shelf CMS (like Drupal for example) and instead build our own. This wasn’t a decision taken lightly and one day I’ll fully explain the process we went through to make the decision but safe to say I stand by it but it wasn’t easy and at times I certainly second guessed myself!
‘Florence’, our publishing application, is entirely focused on the job of publishing statistics and is optimised to do certain things above all else (09.30 publishing for instance.) It is both extremely powerful in its capabilities but also very narrow in its focus and this has strengths and weaknesses. Elements of it ended up being rushed so the UX in places is a little clumsy (which is all the more obvious as elsewhere it is very polished) and there is an ongoing gap in the one place it needs to integrate with internal systems still being worked though.
All-in-all though it works, it is quick and it gets the job done. It also benefits from the same opportunity for continuous improvement as the rest of the ‘platform’ so will continue to get better and better. The feedback loop with the users is pretty tight — given they site 20 feet away from the dev team — so I’m sure those rough edges will soon disappear.
So there we are — I’d call it a solid B. The foundations have been laid for all these ambitions and while there is more work to be done to completely deliver on the opportunities that is how it should be. As we have always said launching the site was just the start — now is when things get interesting.
One comment on “Something to prove..”
Comments are closed.