Five things I learned from working on Customise My Data
(or: How I learned to stop worrying and love the lower layer super output area)
The Welsh language word for statistics is “ystadegau“. This is a combination of “ystad” – state of – and “degau” – tens. I like this because it is a reminder of what we do at ONS. We report on the state of the tens (and sometimes the hundreds, thousands, millions and billions as well, but that’s not as poetic).
In our society a lot of decisions are made on the basis of what we report about the state of the tens. Policymakers use ONS figures to devise and determine policies and funding that affect every one of us every single day.
Customise My Data
Since I rejoined ONS as Product Owner of the website in December 2016, the biggest piece of functionality that we’ve been working on is Customise My Data. This went into public beta a few weeks ago. You can read the full description in the link but all you really need to know is that I live in Cardiff and I have a daughter who is almost old enough to go to school.
If I want to check how many other children there are who are the same age to see whether school places are going to be a problem then I would currently end up in lots of words or in a big spreadsheet. Customise My Data means that I can choose age, location (and sex if I want) to and give you a direct link to the fact that ONS estimates that there are 4425 children the same age as my daughter in Cardiff[1].
I can then use “adjust filter options” to add additional years to see if this is different to other years. This is such a useful option that it’s already being used to solve family arguments[2].
It’s been a lot of work by a lot of people to get this far. In the finest traditions of blog posts, I offer you five things that I’ve learned as part of this process.
-
Fixing big problems feels good for everyone
When I worked for GDS I worked on several services with departmental or agency teams where the work we did was criticised as avoiding complexity and amounting to little more than cosmetic changes to a website front-end. Whatever you think about this [3] engaging with all of the complexity in CMD is closer to free range bacon than “lipstick on a pig”. And yes, we did get more than a bit metaphorically muddy on a few occasions.
Contrary to what you might expect, wrestling with such a big set of problems is a great experience. What we deliver on CMD will be probably the most important part of the pipeline that will span from the creation to the publication and use of statistics in the UK. Having a role in delivering that is more likely to make you get out of bed in the morning than propping up some Jurassic era code for a while longer or tweaking some UI elements to try and confuse your users a little bit less.
-
Run towards the hard stuff
As a product owner, I’d like to say that it was a hard job to set the vision and scope for the first few sprints of Customise My Data. The truth is that I went through all of the functionality that we’d agreed to be within scope and assessed how big and scary and difficult it was [4]. I then put the biggest and scariest and most difficult items first.
This is the reason that we started the project by running tests between different database options and opting for a Graph database. This surprised us a little bit at the time [5] but it’s not a decision that we’ve regretted. It would have been an almost impossible decision to make at any other stage in the project.
Working through these big issues first was often unpredictable in terms of the amount of work they would generate. This was sometimes frustrating at the time but it did ensure that we’ve had absolutely zero “oh-bother-this-could-derail-everything-why-oh-why-didn’t-we think-of-this-earlier” moments later on in our beta phase. This is probably the first digital thing I’ve helped create where I can say that.
-
If no-one recognises what you’re building then it’s a new pattern
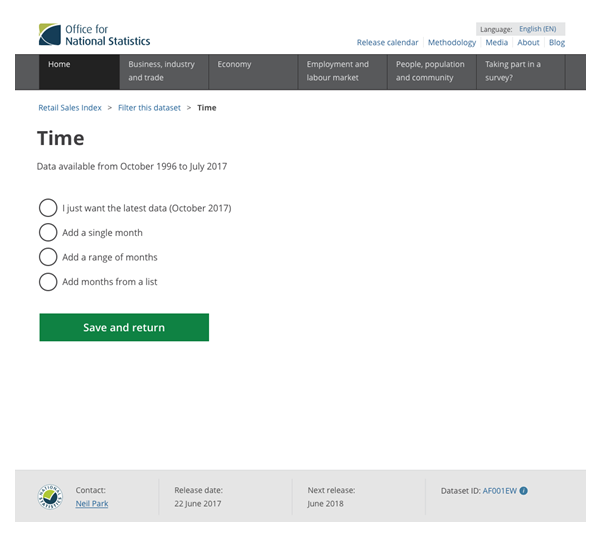
We called our Beta “Customise My Data”. So far, no-one has noticed that the word “Customise” doesn’t appear anywhere within the Beta itself. The reason for this is that we tested using “Customise” as the text on the button that people press to start their journey to choose the data that they want. It didn’t test well. The typical response was “that sounds like a lot of work”.
I should be honest here: I was one of the team members who thought “Customise” would work. When I tried out the other option I liked on users, it got an even worse reception. By the time we tested and decided on “Filter” it was too late to internally rename the team working on the Beta and so “Customise” lived on.
It took us a while to agree “Filter” because even that didn’t fully explain to the user what they were about to do. One user we tested with was certain that it would let him download some PDFs. This meant that we kept on trying to identify the perfect way of describing what we were offering. We never found it. And I think that’s OK, because in this case it meant that users didn’t recognise the pattern [6] we were offering them. The critical aspect was that they did understand it once they saw it and once they had used it once [7]. It was a new pattern and one of the things about digital is that there are sometimes no analogues to existing patterns.
-
Iterate. Then iterate again. And then again. And again.
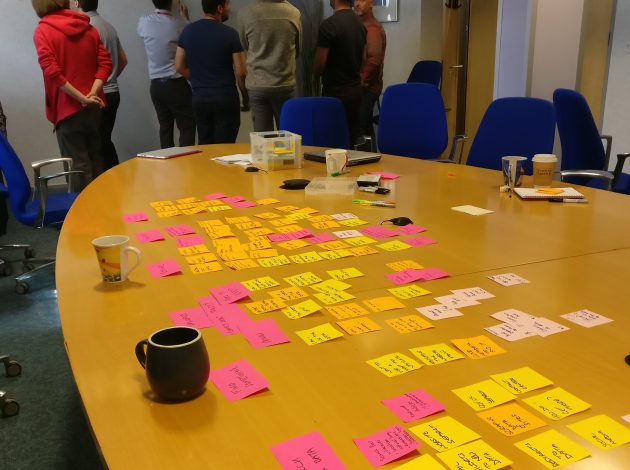
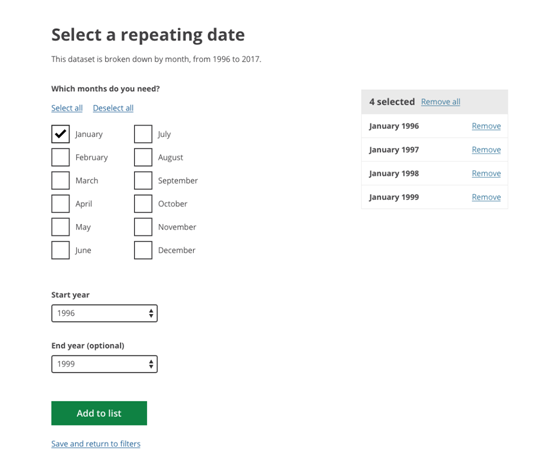
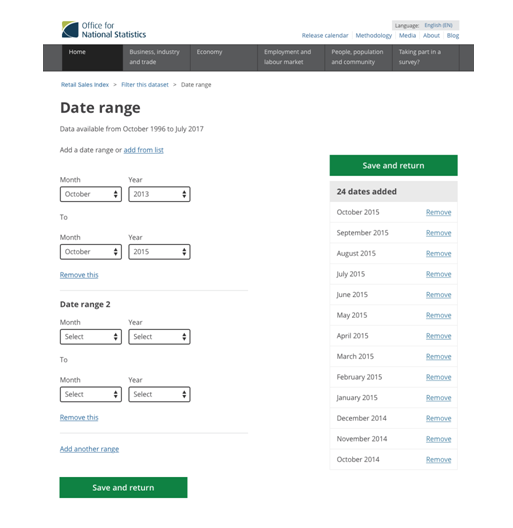
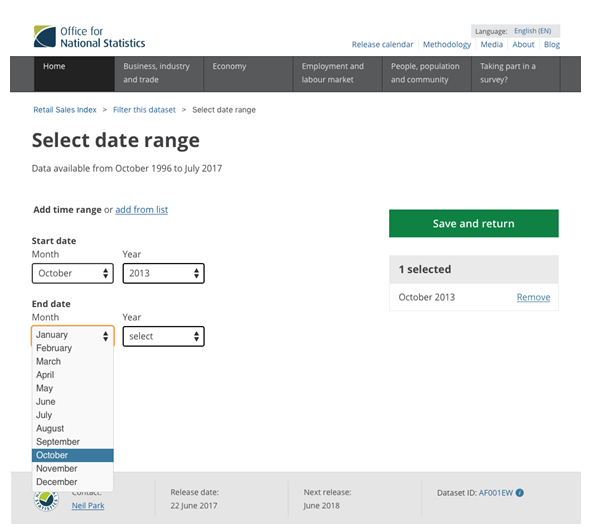
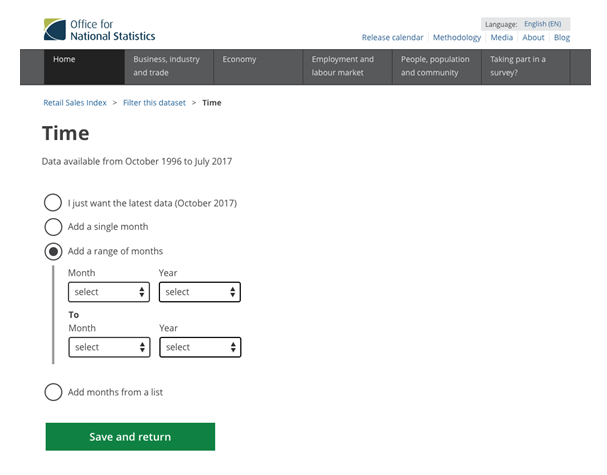
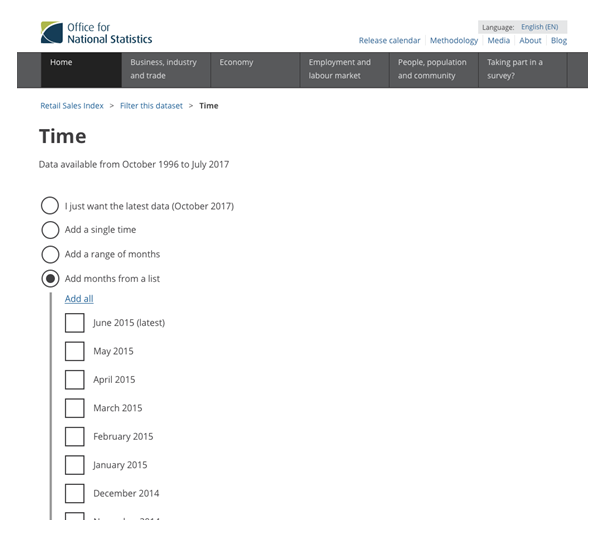
The images spread throughout this blog post weren’t created by me: they were created by our talented UX team of Benjy, Damien and Tom. They’re of a single element of the Customise My Data user journey. And they’re only a selection of the total number of iterations we’ve gone through to get to the design we have now.
In the bad old days [8], this element would have had a design made at requirements stage with possibly a single set of tweaks made in response to business feedback. It would then have been finalised, delivered and launched as part of a system made live and thrown into the long, budget-free grass of system maintenance. For a complex pattern like Customise My Data this would have given us almost no chance of delivering a system that worked for the user.
Our beta took us 16 sprints (iterations), or 8 months, to deliver. That could have been 80 years if each iteration took a five-year cycle of commissioning a new system, agreeing the requirements and then delivering something that, if you squinted, looked a bit like some of the requirements once budget constraints were factored in.
Customise My Data sprints took two weeks. We had user research sessions with real users (and involving team members) in every sprint. We were able to design and deploy changes within a couple of weeks of testing taking place. It’s easy to say “agile means iteration” but putting all of this in place is hard. And continually being open to the fact that what you’ve done still isn’t quite right is mentally taxing and easy to duck. The practice of iteration takes courage, resilience and commitment; and it’s absolutely worth it.
-
Give time and permission to fix the big stuff (and avoid repeating yourselves)
Customise My Data was a journey into unknown complexity in data, technology, and user behaviour. It’s tempting to rush ahead to deliver a solution before understanding the edges of the landscape you’re operating in.
One of the most important factors in our work on Customise My Data has been to give ourselves the permission and the time to understand the landscape properly. In the current sprint the teams working on the project have a double-figure number of stories that are defined as spikes, or investigations. This is the first project I’ve worked on where we’ve had a separate Trello label for “spike”.
As another example, “Geography is hard” is a Customise My Data axiom. We had a number of workshops on this and we started to get frustrated that we were revisiting conversations without resolving anything. We fixed this by allowing ourselves the space to concentrate on the problem properly. This meant committing everyone involved to a week where we cleared away any other distractions. We did this within the framework of a design sprint and Benjy has blogged more about this [9].
The end (but not the end)
This is a personal view of what I’ve learned. Collectively we’ve learned a lot more and I hope some of my colleagues will be along to blog as well. In the meantime, my thanks go to everyone involved so far for their commitment, patience and belief. The work on Customise My Data doesn’t stop here: please go and try the Beta and help us make it better by giving us your feedback.
[1] This is the first time that I’ve seen someone directly link to an ONS figure as a standard HTML hyperlink. I can’t tell you how excited that makes me. It appears that I’m already old but when I’m reduced to sitting in an armchair next to a fire I’ll probably be telling the young people about how I thought Netscape 1.0 and a 33600 modem was amazing, right before telling them that I was the first person to link directly to an ONS statistic. [back to main text]
[2] So far, only in our User Researcher Alison’s household. But I’m hoping for more such instances. [back to main text]
[3] I’ll leave my full thoughts on this for another time but let’s say that I’m not sure that was always a fair verdict. In my experience, there was always consideration of which priority would deliver the most to the user and the creation of a long-term plan. [back to main text]
[4] Not a completely scientific method but often by measuring the length of the breath sucked across closed teeth by the tech lead immediately after you mentioned it. I’m proposing calling this method of estimation the “used car salesman inhalation index”. [back to main text]
[5] Our Service Manager’s reaction was something like “well, I thought that we might want to try that at some point in the future, but Bloody Hell I was not anticipating that now”. [back to main text]
[6] I think this is a pattern and not simply a different design. [back to main text]
[7] As the Digital Service Standard says, “helps users do the thing they want to do at the first attempt without having to understand government”. [back to main text]
[8] As established in [1] I’m old so I was around for some of these and can confirm that this sort of approach did actually happen. [back to main text]
[9] Full credit to fellow product owner Rob for suggesting this in the first place and to everyone else in the team for supporting this, whether by taking part or by not being annoyed that people weren’t around to do other stuff whilst it was going on. [back to main text]