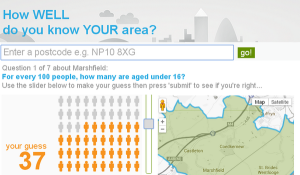
So how well do you know your area?
Head of Digital Content Alan Smith discusses a new approach to visualising ONS data with a personal touch.
Today (21 July) sees the release of an interactive quiz game – ‘How Well Do You Know Your Area?’ – which represents a very different vehicle for ONS data from our usual outputs. I thought I’d share some of the thinking behind the product’s design and implementation.
Firstly, last year, I was really interested in the results of an Ipsos MORI report – The Perils of Public Perception – which highlighted how different public perceptions of statistics are from the official figures. For example, one of the questions in the survey asked respondents to guess the proportion of people in the country who were Muslim – the mean answer was 24 out of every 100, whereas the official 2011 Census figure is around 5 per 100.
Those of you who have read “Thinking Fast, Thinking Slow” by Daniel Kahnemann might recognise a common thread – the notion of people as poor intuitive statisticians. One reason offered for this is that people’s intuitions are very often influenced by their own personal experiences as well as reports in the media – a potent cocktail. I was fascinated by the challenge of what we could do to bring the same sort of myth-busting approach as the Ipsos MORI work to the local level, and so I guess that’s where the project kicked off in my head.
Secondly, I was at the Association of Survey Computing’s fascinating conference on Gamification, Text Analysis and Data Visualisation last September, where I was really blown away by some of the gamification examples relating to data collection. A comment that stuck in my head that day was from someone who said that we have a lot to learn from the field of advertising where the most effective adverts are not necessarily the prettiest, but the ones that intellectually reward the viewer. For me, rewarding the viewer/participant of a data visualisation is all about enlightenment – showing things that people are not expecting to see is a great way of creating a memorable experience.
Another related influence has been the kind of content that Andy Kirk has described as ‘participative visualisation’ – exemplified through things like the New York Times dialogue quiz ‘How Y’all, Youse and You Guys Talk’ and the BBC’s Olympic Body Athlete Match. This kind of content clearly works because of the visual/personal/social combination – placing the user at the centre of the content provides added incentive for her to participate and share.
These inputs led us to create something that would demonstrate the potential of ONS’ digital services. The game is relatively simple but uses 2 ONS APIs to create a personalised service – the Neighbourhood Statistics Data Exchange, which gives web developers access to local univariate 2011 Census data and the ONS Geography Open Geography portal which allows dynamic extraction of map boundaries. If nothing else, I would love developers to pick up on these resources and use them as sources for some great creative ideas of their own.
The game itself has been developed using HTML5 and open source javascript frameworks, most notably d3js, jQuery and Modernizr. We wanted to make the game gently responsive, so that users on mobile devices will have a more pleasant experience – after all, this kind of content works especially well for the person with 5 minutes to kill waiting for the train. We also found that modest use of animations and transitions transforms the ‘gamified’ aspect of the quiz – users who are a long way off with their guesses have to suffer the indignity of a longer animation to reveal the difference! In this respect, I doff my hat to the game show ‘Pointless’ – millions of people hooked on a show with one animating bar doing most of the legwork…
The whole project has generated a whole set of ideas for future work, which we’re keen to look at in the context of our broader program of work transforming ONS’ product portfolio. Don’t worry, we don’t see every ONS output becoming a quiz – but initial feedback suggests that this kind of content represents a fascinating addition to the portfolio.
4 comments on “So how well do you know your area?”
Comments are closed.

Have you made more quizzes since this? I always thought the Social Attitudes or Understanding Society surveys would be a good candidate. I made a prototype of the former a few years ago… http://tropic.org.uk/~crispin/quiz/
We’ve done a few quizzes since. Here are a couple of them…
https://visual.ons.gov.uk/what-are-migration-levels-like-in-your-area/
https://visual.ons.gov.uk/test-your-knowledge-on-the-gender-pay-gap/
Social attitudes survey does sound like an interesting example.