12 Tweets of Christmas
Statisticians from our UK Manufacturers’ Sales by Product Survey, often referred to as the PRODCOM team, came up with idea of sharing manufacturing statistics relating to the song, the 12 days of Christmas. This survey has a lot of detail and can be broken down into specific products which is why this area was more appropriate for this project.
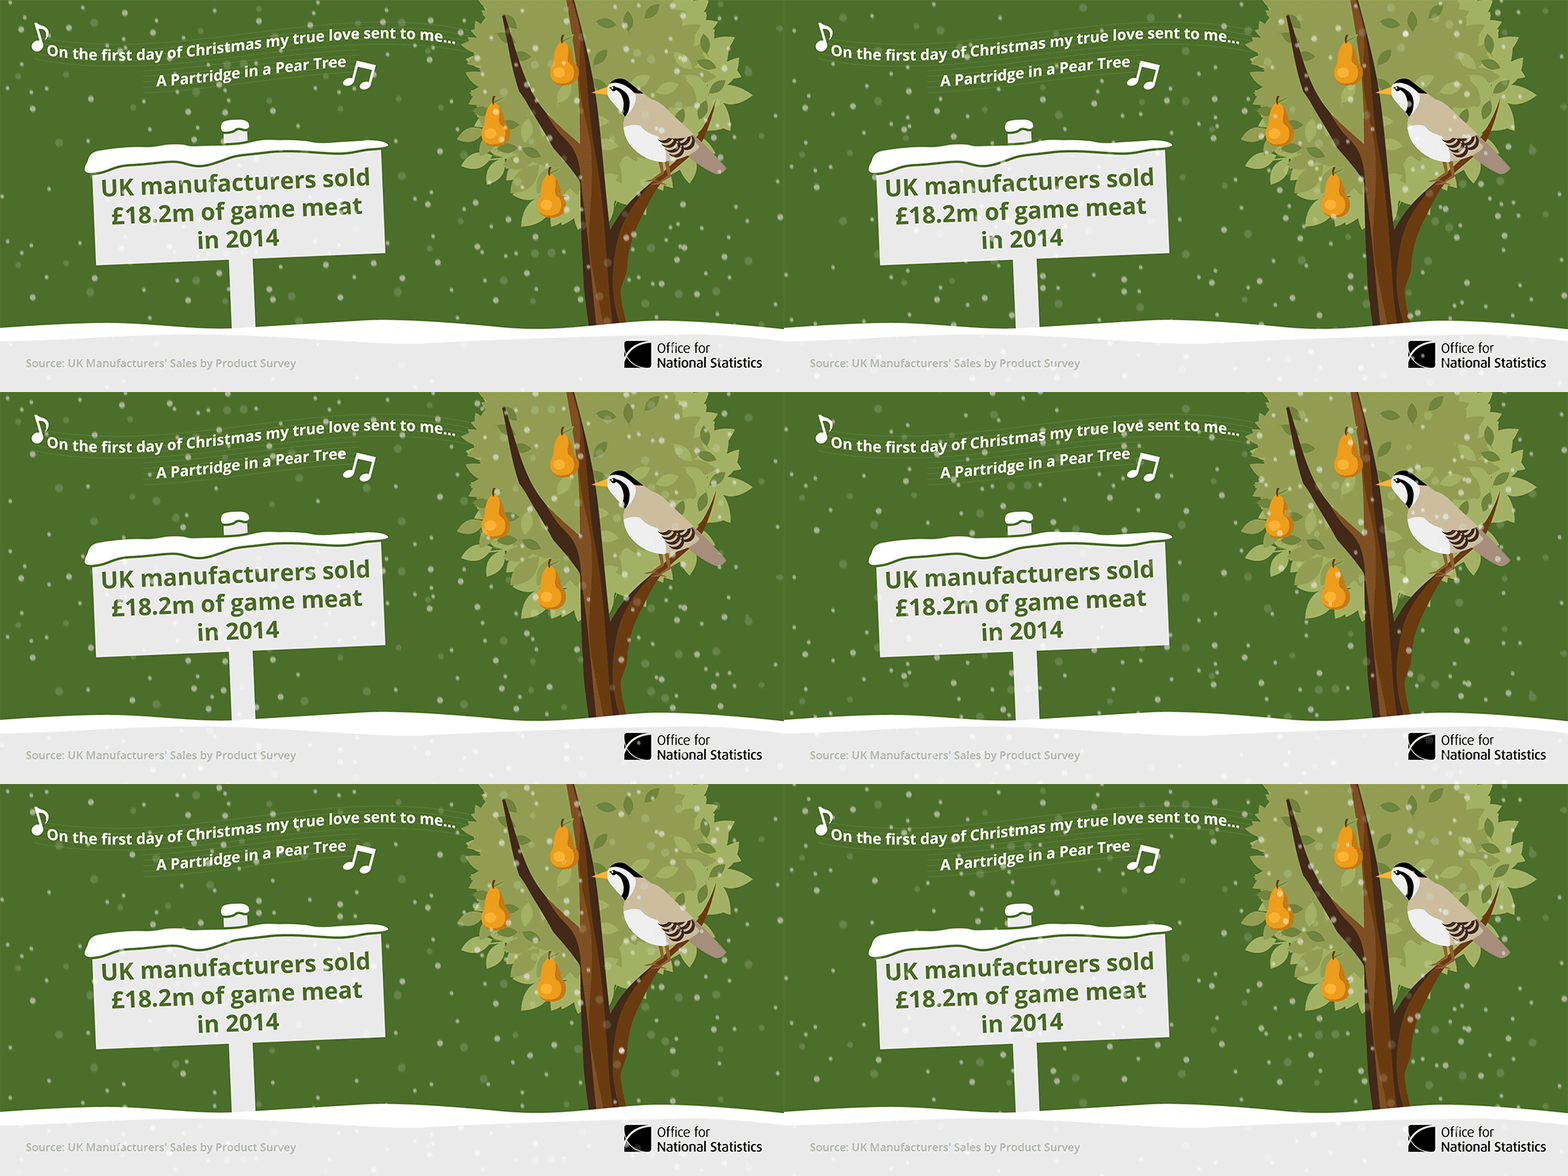
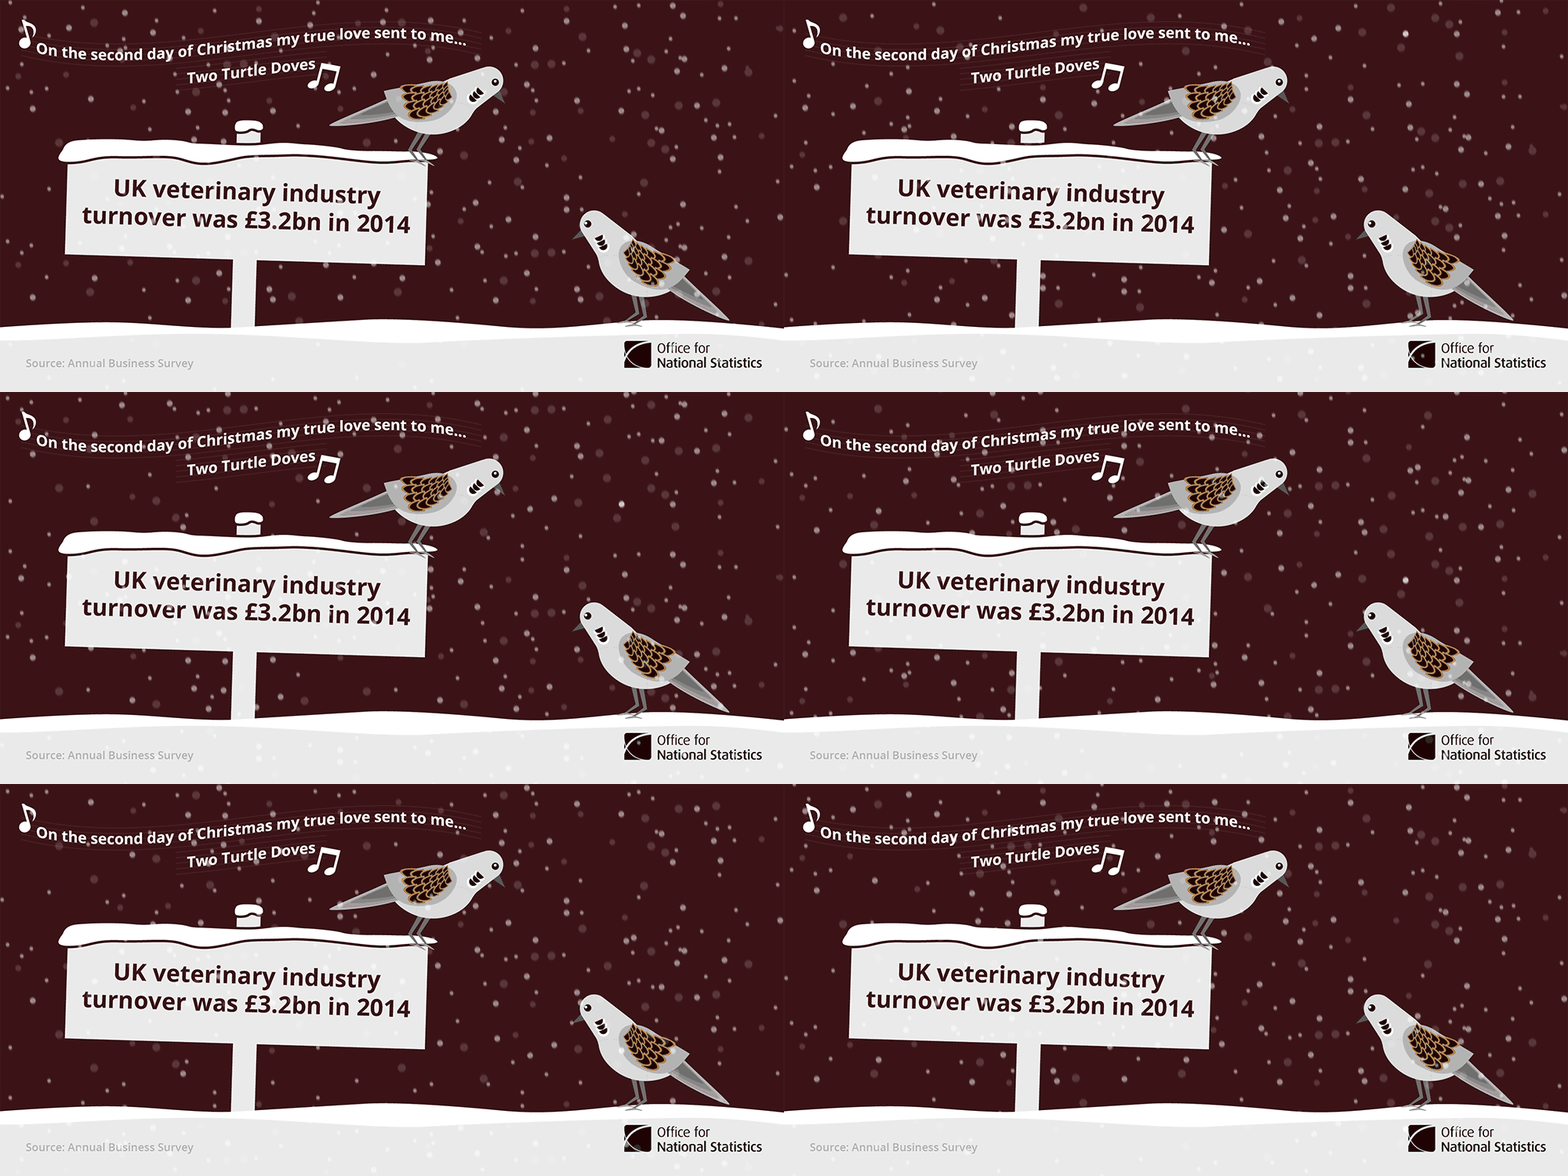
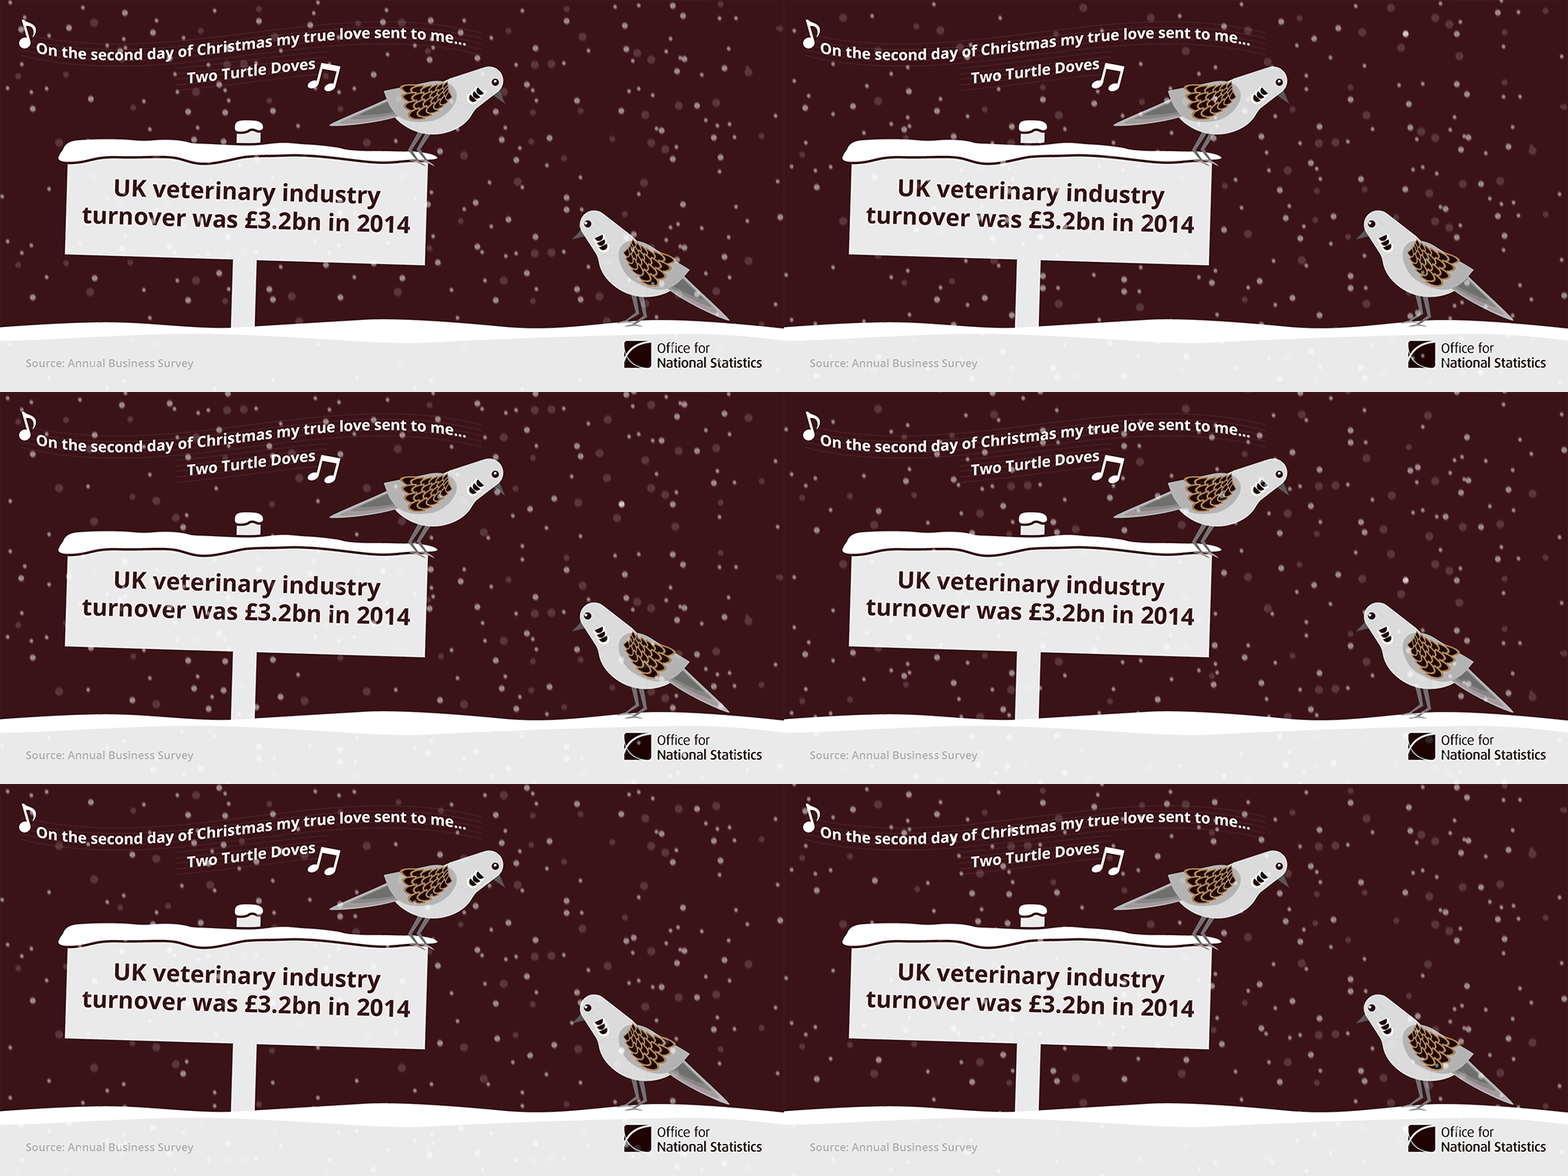
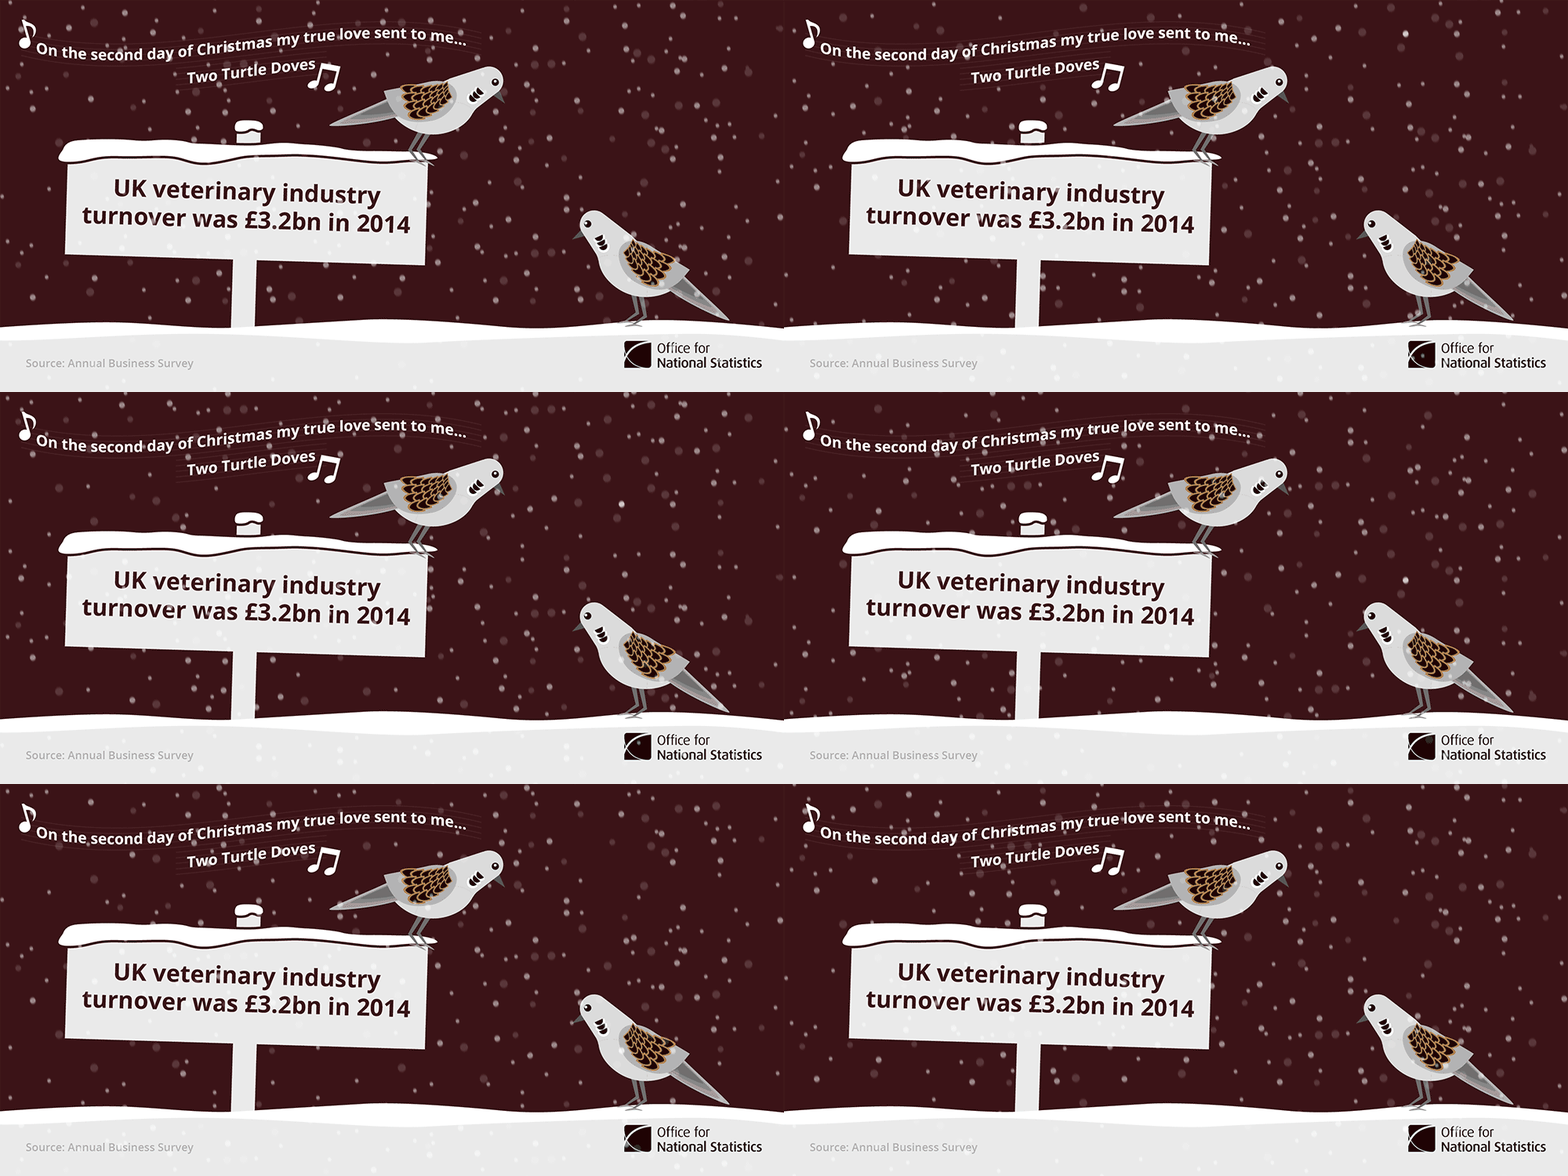
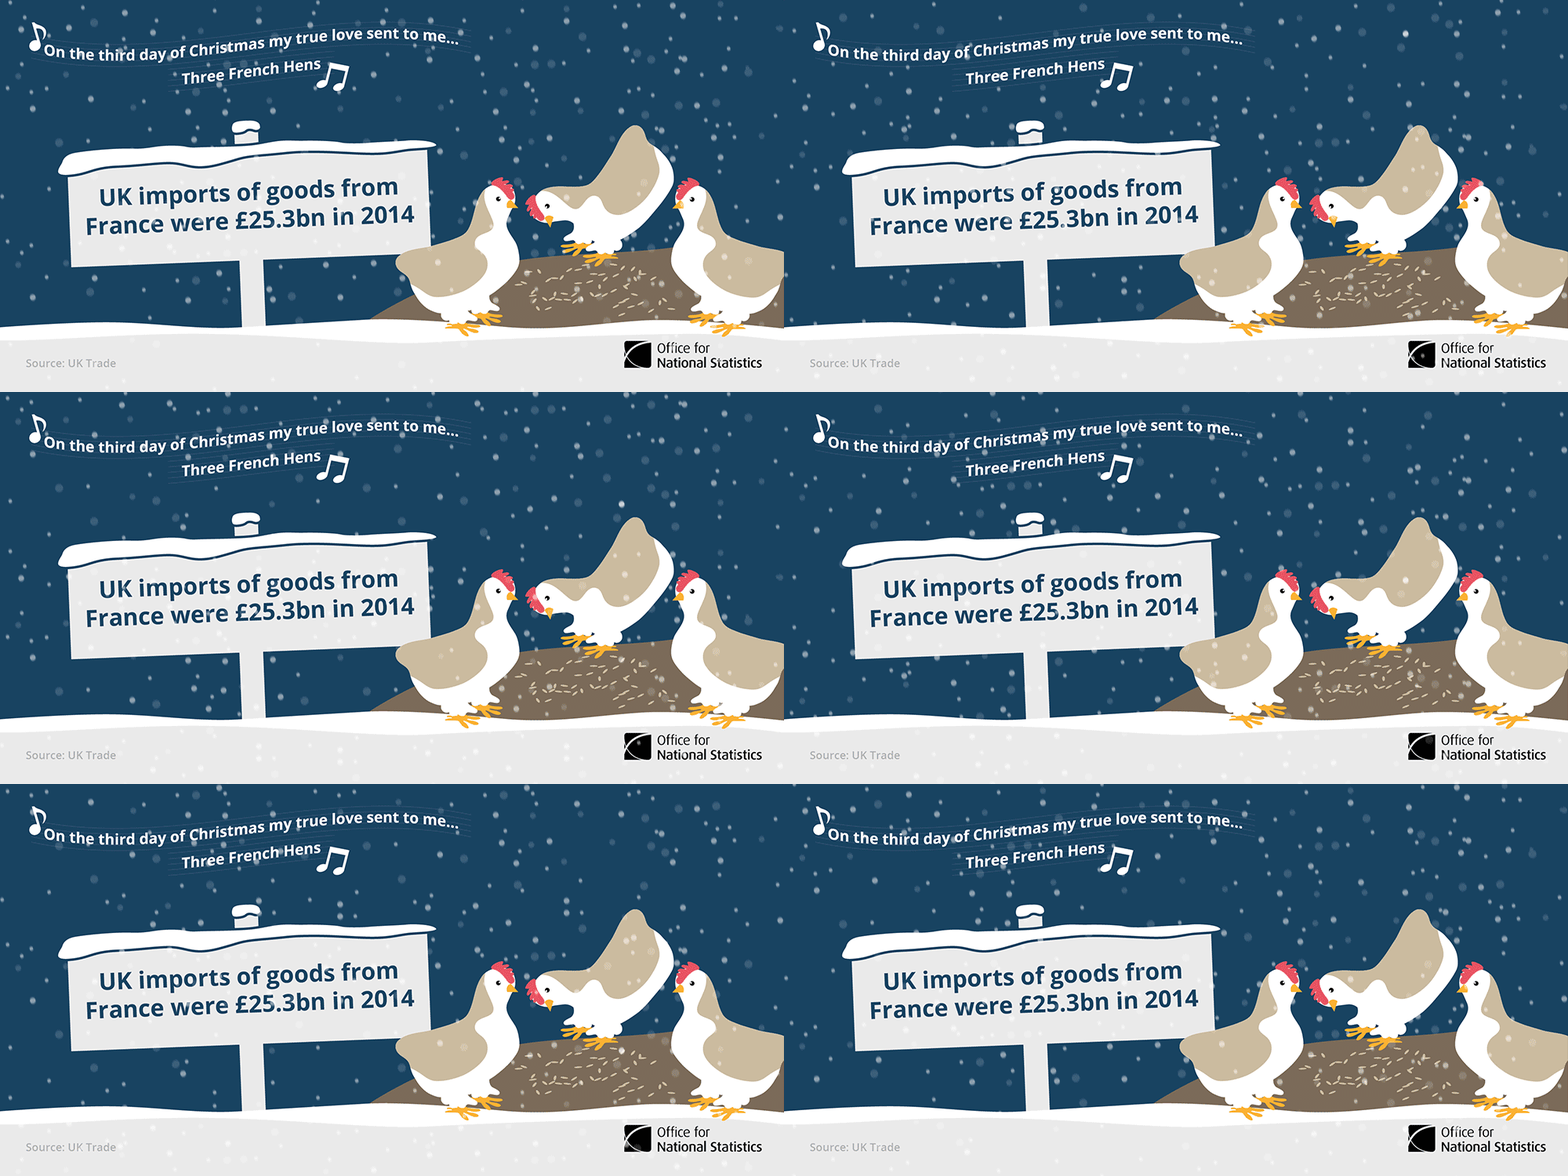
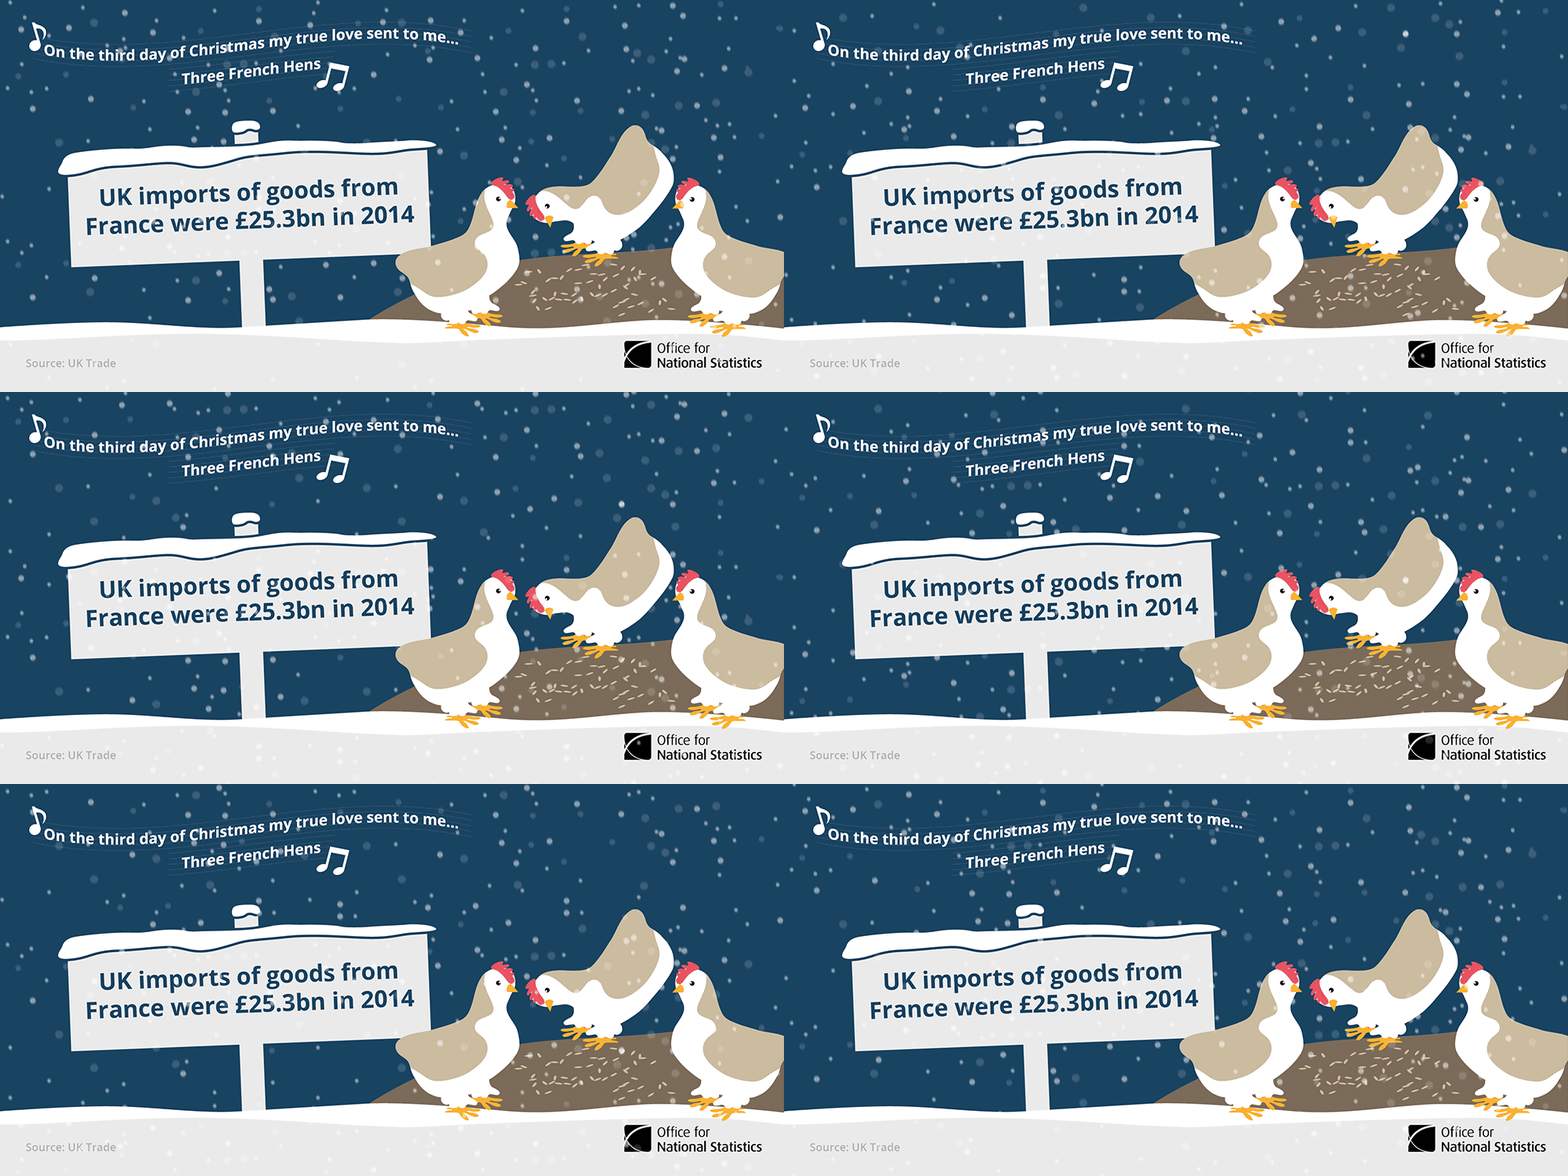
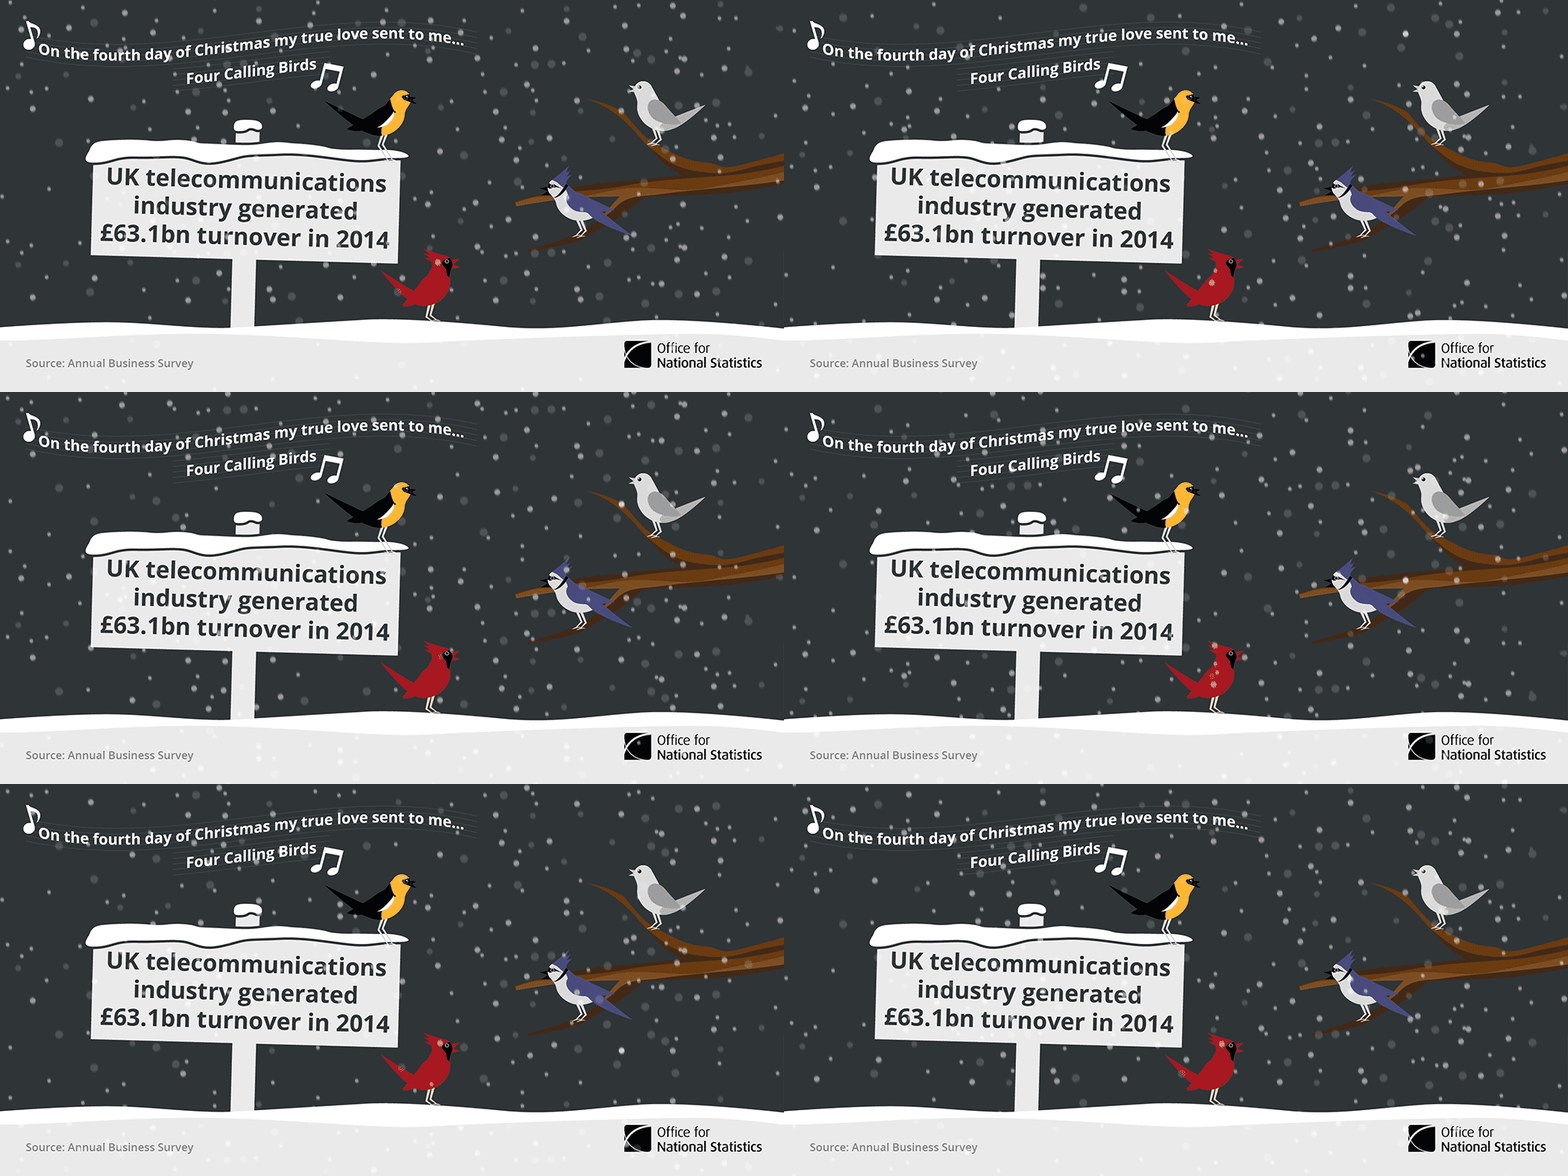
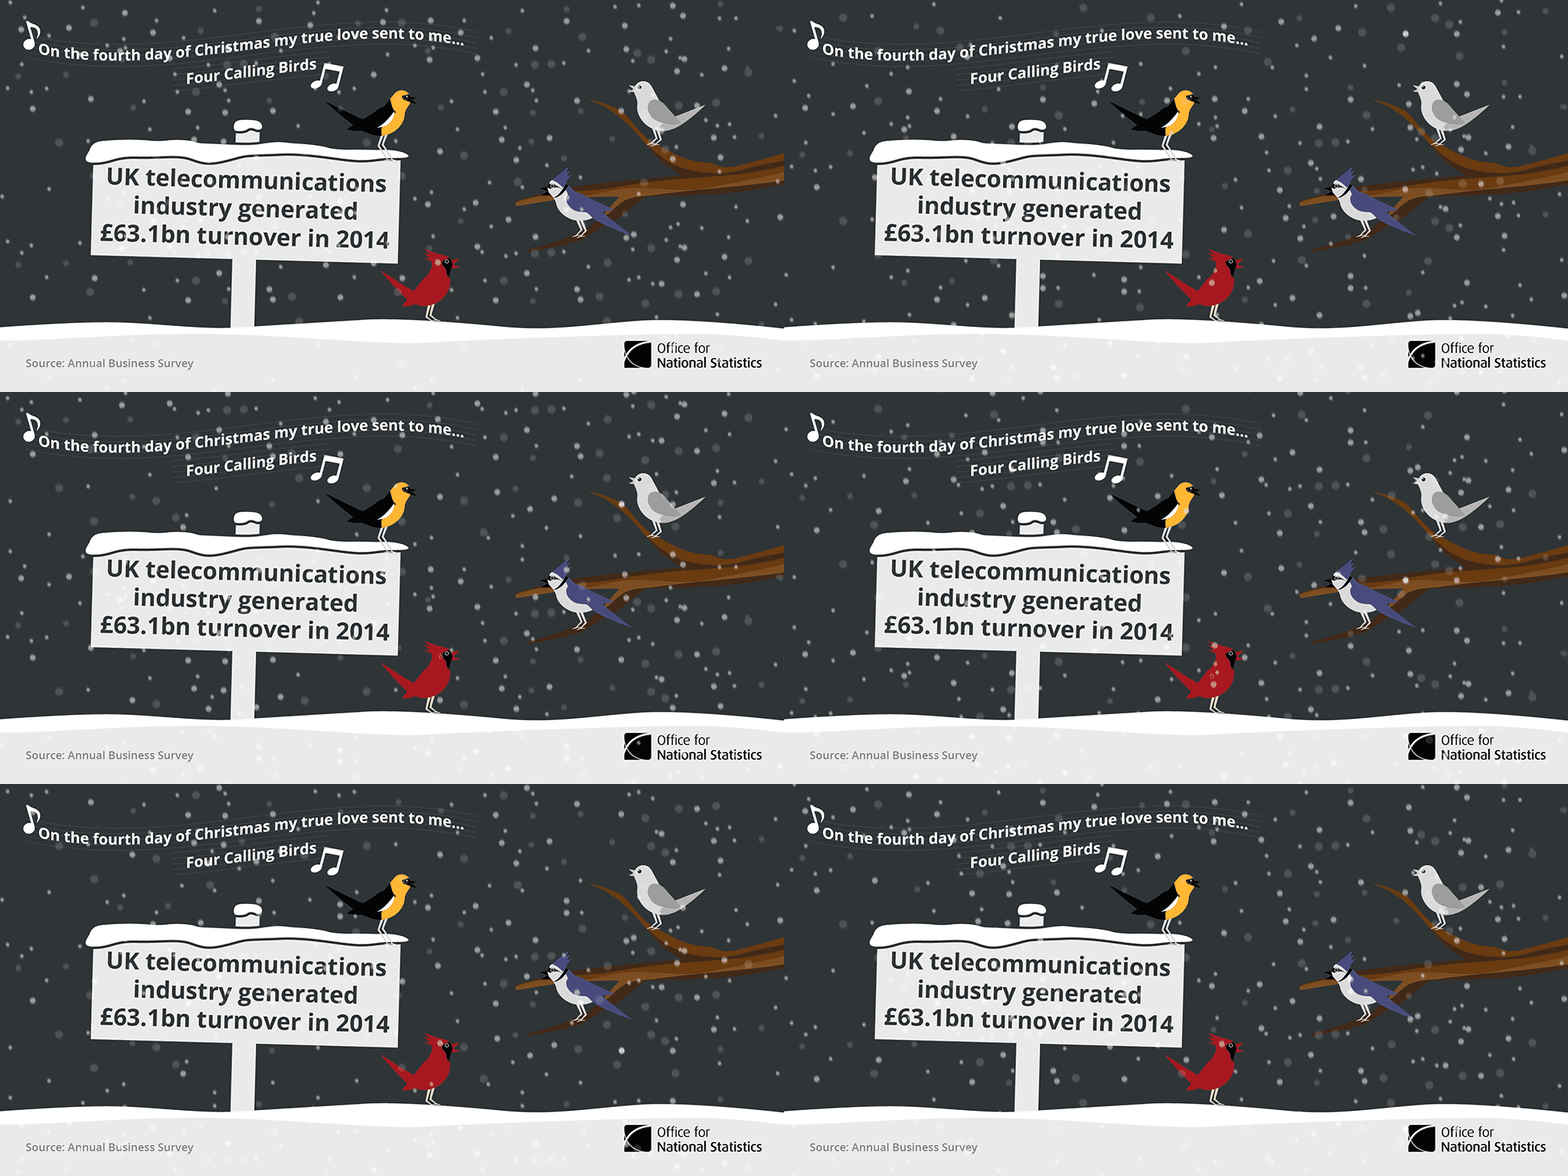
We worked with them to find statistics that relate to each verse of the song then one of our graphic designers, Aaron Hill brought the stats to life with some cool graphics (we think they’re cool).
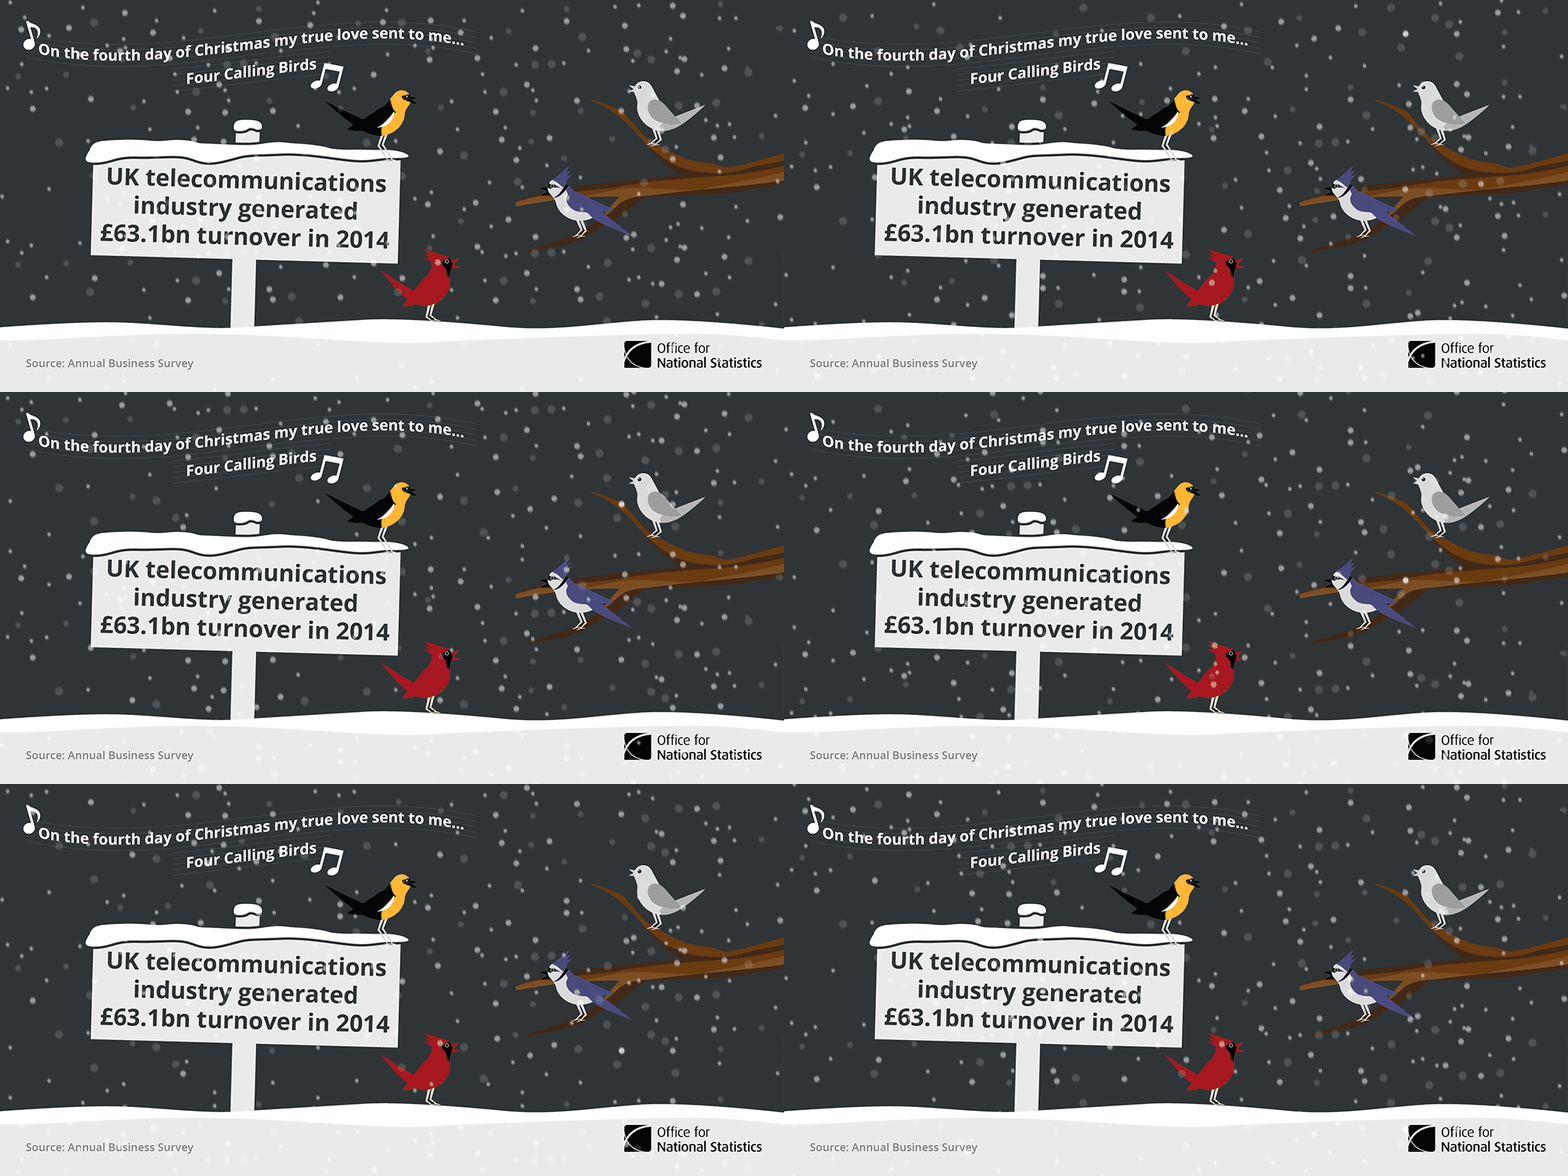
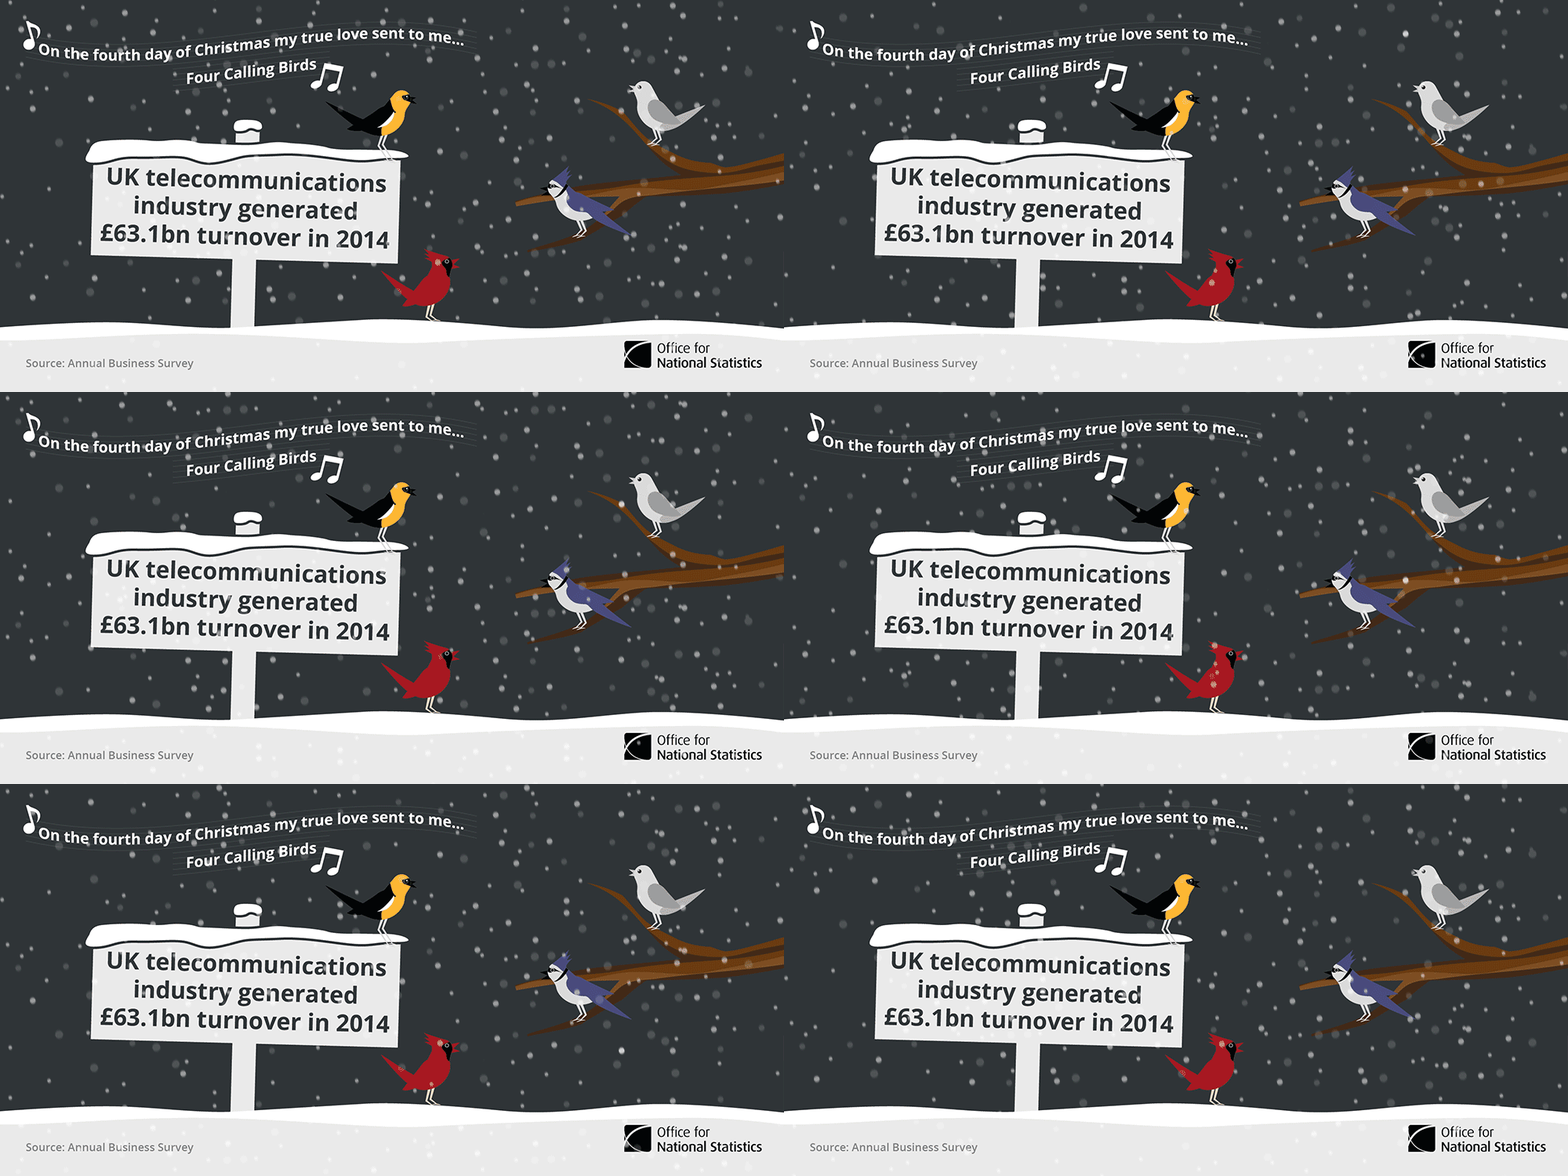
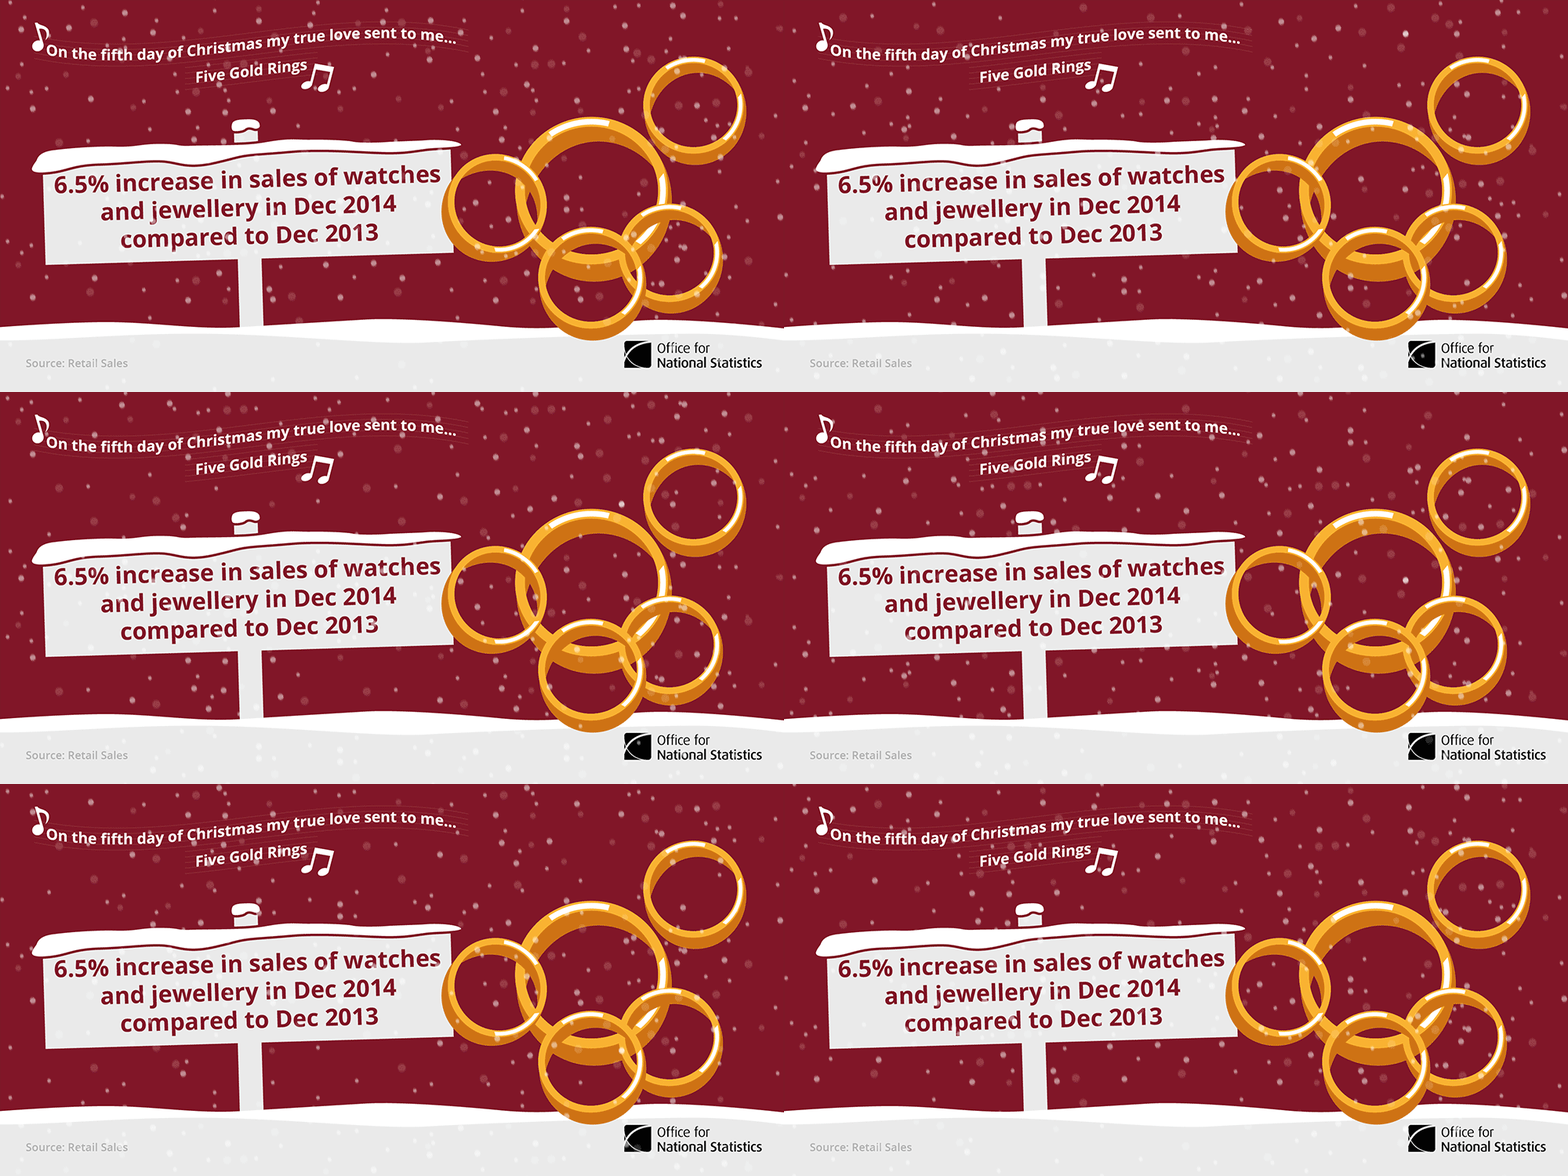
Our graphics for the 12 Days of Christmas
The GIFs on Twitter and JPEGs on Facebook were sent out daily at 12:30pm from the 25 December to 5 January. Stats fans liked the artwork and most of the feedback was that people enjoyed the content.
https://www.facebook.com/ianjames.hopkins/posts/1129658257045167
One follower wasn’t so sure…
The most popular tweets for engagement were closer to Christmas with the tweet on the 28th having the highest engagement rate of 1.5% (130 engagements).
Other popular posts were from the 25th, 26th, 27th December and 2nd January.
One comment on “12 Tweets of Christmas”
Comments are closed.