So long and thanks for all the stats!
One of the founder members of the visual.ONS team has moved on to pastures new. Hannah Thomas has been an integral part of the team, which has pushed the boundaries of data visualisation. Here she writes about her time at ONS. We will miss you StatsHan!
TaTa For Now ONS
by Hannah Thomas
July 27, 2012 was my last day as a teacher and I will never forget the sense of relief.
It was a turning point in my life – I was switching from a difficult and emotionally-draining job to a role in the civil service in the Office for National Statistics – which I imagined would be far less demanding.
The allure of flexible working, cheaper holidays, being able to go and get a cup of tea whenever I liked and never having to mark an exercise book again made it seem like a dream job.
My ONS journey
Three and a half years later and while it is a fact that life at ONS has been less stressful than the three years I spent teaching it doesn’t mean I haven’t worked hard or not been stimulated. Quite the opposite in fact, I have been given many opportunities to develop and grow into a job that I really do enjoy.
I started in labour market analysis and my first big publication was on “underemployment” (a hot topic at the time when the country was just about pulling itself out of the Great Recession). There was no Digital Publishing Division (DPD) at this time so I developed this little beauty all on my own using nothing but Google images, Microsoft Office and Microsoft Paint:
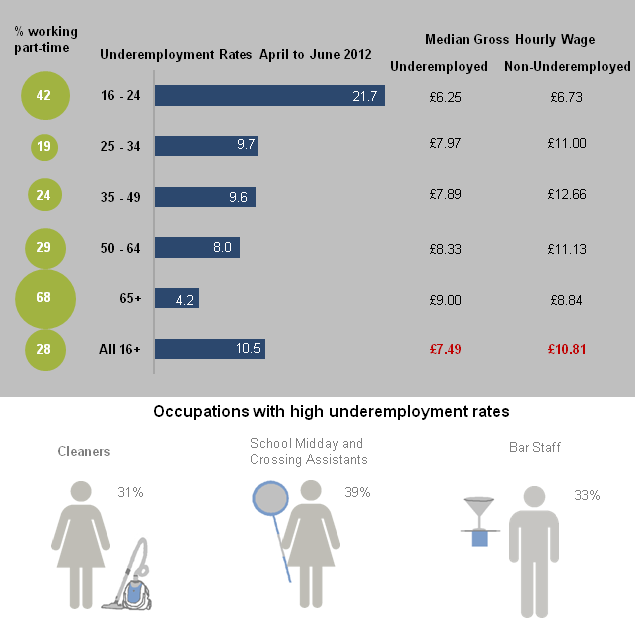
. . . and the crowd went wild!
You may snigger now but my lollipop stick, vacuum cleaner and martini glass were all extremely well received!
As the ONS grew and developed around me I passed the statistician fast stream and decided the place for me was DPD. I didn’t really know what I wanted to do and I don’t think Matt Jukes had a clue what to do with me either but as he felt I was too dangerous to have floating around, he found a place in his team and I moved upstairs.
Onwards and upwards
Now, this was around the start of 2014 and I definitely remember feeling as though I had moved from the Dark Side, being as I was, the only statistician in DPD. And a previously rogue statistician at that – following the success of my lollipop lady I had moved onto making monthly infographics for the labour market division.
But I was ready to assimilate and made a lateral move into the editorial team. This meant no more potching about with Adobe Illustrator and Microsoft Paint – I now deferred to the expertise of the design team for that – concerning myself more with writing and communicating.
There wasn’t a whole lot of fun to be had in those early days. We wrote “short stories” (as articles were then called), created You Tube videos and developed many, many infographics. I think I lacked the confidence to speak my mind fully at this time (something I know will shock some readers of this blog)!
One highlight though, as ever, was the baby names release in August 2014 – this was the first time we looked at the effect of sport, music and pop culture on the popularity of names given to new babies:

The creation of Visual.ONS
When Visual.ONS came into being in early 2015 it was another turning point for our team at ONS – offering more freedom and a sleeker look to our work. We were also able to incorporate interactive material and data vis through a mash up of the design, editorial and data vis teams under Alan Smith.
This was very welcome change and this blog post was one of my early favourites – as it was driven by my own interest in the alternative answers to the “What is your religion?” question on the 2011 Census.
However, another, far more substantial turning point was looming close for me as I left ONS on March 1, 2015 awaiting the birth of my first child who arrived two weeks after his due date, on April 2.

Seriously – what mother can resist posting a photo of her beautiful baby?
Life after birth
It’s now been 14 months since I returned to work following my eight month maternity leave – and I have moved desks twice in that time (I would say that’s a record but its probably not*).
I have also been involved with around 20 posts on Visual.ONS since my return and while some of them have been frustrating to work on, I can honestly say that overall these last 14 months have been enjoyable and enlightening – there were even some projects I didn’t want to let go of!
Here are some of my favourites:
- The stats are strong with this one – the UK film industry and star wars in society
- What are your chances of living to 100?
- The debt and deficit of the UK public sector explained
- The popularity of the name Muhammad/Mohammed/Mohammad
- Baby names since 1904 – how has yours performed?
- What’s the best time for a wedding?
- Five facts about Halloween – a monster mash of data
- Explore 50 years of international migration
A big thanks to: Lisa Jones, Lauren Bradford, Joanna Goodwin, Rhodri Griffith, Tom Davy, Carlie Edge, Darren Waters, Rob Fry, Zoe Hartland, Frank Donnarumma, Shayla Leib, Paul Heinicker, Jon Nixon, Bethan Russ, Laura Wilson, Lisa Davies, Jamie Jenkins, Tracy Williams, Linzi Pidgeon, Rachel Lewis, Rob Chambers, Jen Watkins, Alan Smith, Matt Jukes and anyone else who I have had the pleasure of working with.
* It’s not that I mind a desk move – if its for the benefit of the business I am all for it. The problem is my last desk move brought me to what must be one of the worst seats in the division – being as it is, next to the noisy and annoying photocopier (do you really need to make 10 copies of that 50 page document?) and the noisy and annoying automatic doors (which bring in such strong gusts of cold air that learning how to drape a shawl elegantly over my shoulders has become a necessity). We have also, rather disconcertingly, had a large crane waving around outside our window for the past couple of weeks – which is one way of keeping your staff alert.
One comment on “So long and thanks for all the stats!”
Comments are closed.
Such a lovely blog which brings back memories of my own year working with you back in PPA! Not sure I’ll last longer than 3 years in teaching myself and it’s so reassuring to see someone find something fulfilling to so instead!
Lots for you to celebrate and be proud of xxx congrats on the new role and I hope to catch up with you dai and little I soon!