Embedding ONS interactives in your website

Here’s a simple guide to embedding our interactive maps and charts and making them responsive, so they look their best…
Read more on Embedding ONS interactives in your websiteHere’s a simple guide to embedding our interactive maps and charts and making them responsive, so they look their best…
Read more on Embedding ONS interactives in your websiteConferences are a great way to learn and view the wider field of your profession. Often in data visualisation, you…
Read more on What’s French for data visualisation?As Visual.ONS closes down and moves to the main ONS website, we wanted to reflect on the challenges we’ve faced…
Read more on Rising to the challenge of communicating statistics to the wider publicThree years ago, the Office for National Statistics (ONS) decided to start an experiment.
Read more on Three years of Visual.ONS – what we’ve learnedIn January 2015 we launched a Beta called Visual.ONS – a companion website to help us learn how better to…
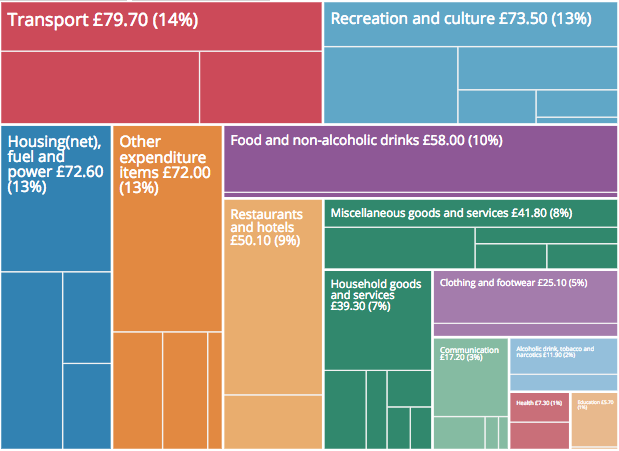
Read more on Visual.ONS is coming out of Beta and we’re moving homeThe 2017 Family Spending data was released today. For the past three years the bulletin has been accompanied by an…
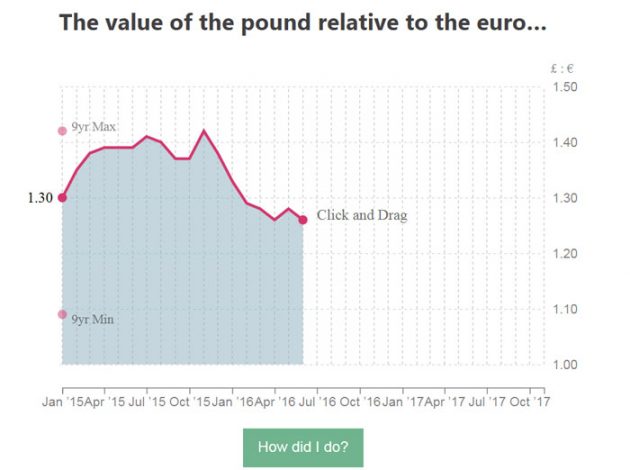
Read more on How to customise an embedded interactiveYou may have seen in June last year we asked people to draw the rest of the line, for several charts,…
Read more on Reusable visualisationLast month I burst out of the ONS bubble and spent a week in a Trinity Mirror newsroom.
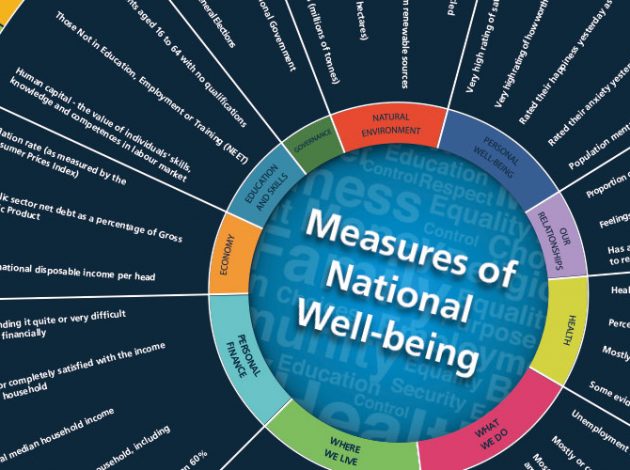
Read more on A week in a newsroomIn 2010 the then-Prime Minister David Cameron launched the Measuring National Well-being (MNW) programme to “start measuring our progress as…
Read more on Reinventing the WheelOne of the founder members of the visual.ONS team has moved on to pastures new. Hannah Thomas has been an integral part of the team, which has pushed the boundaries of data visualisation. Here she writes about her time at ONS. We will miss you StatsHan!
Read more on So long and thanks for all the stats!