Embedding ONS interactives in your website
Here’s a simple guide to embedding our interactive maps and charts and making them responsive, so they look their best on mobiles and tablets and of course on desktop.
This guide is suitable for those with experience editing in a Content Management System (CMS). However, if you’re not that familiar with the CMS then your organisation’s IT or web support team can help you.
We’re going to walk you through using the example of embedding an interactive tool we published recently.
Using an iframe to embed
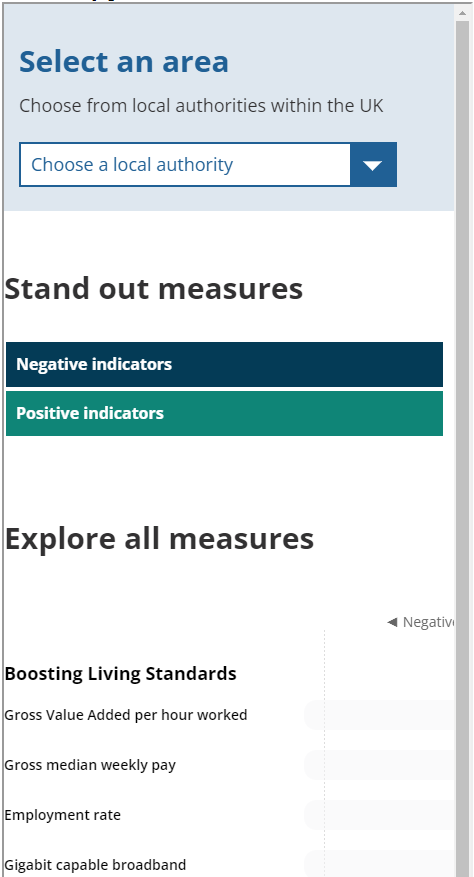
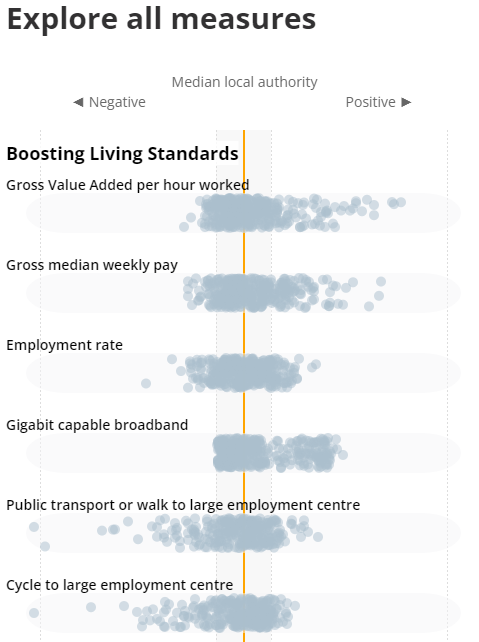
We have published an interactive tool to help you find out more about your local authority area and how it compares with others against a range of indicators.
You can embed the tool, and many other ONS data visualisation and interactives, in your own website by clicking where it says “embed code”.
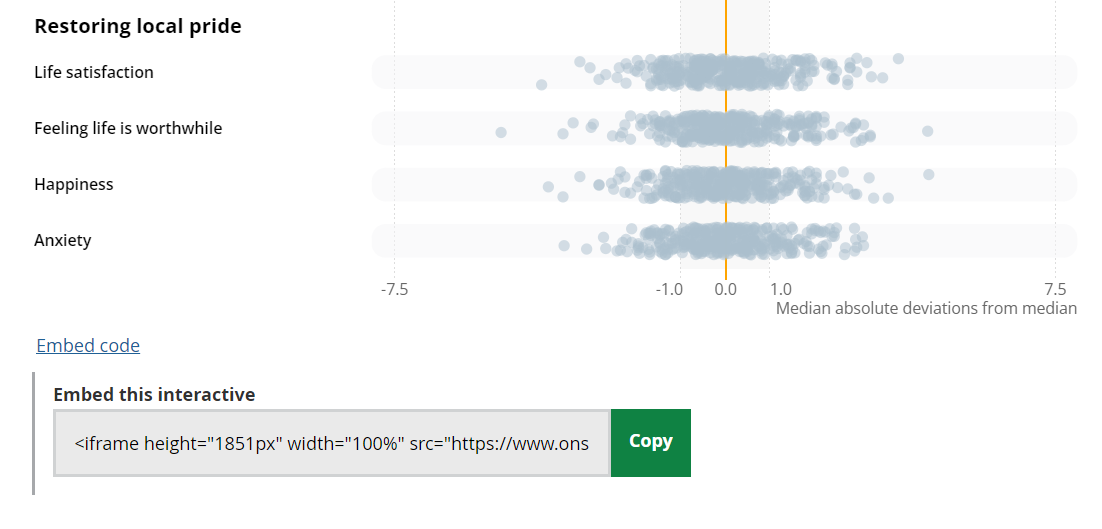
This creates an iframe which will show the ONS interactive if you copy it to your own website or content management system.
Chart titles and subtitles are not copied over, so you can add your own above the iframe in text.
Here’s the code in full:
<iframe
height="1847px" width="100%" src="https://www.ons.gov.uk/visualisations/dvc1786/app/index.html">
</iframe>
This sets the height of the window at 1,847 pixels and the width to 100%, meaning it will fill the whole width of the screen.
You can change those manually if you need to.
However, the iframe alone may not be the best experience if you have a lot of readers viewing your content on mobile phones, using their fingers and thumbs rather than a mouse.
On smaller screens, the interactive will still display but will include scroll bars and require your users to swipe to see parts of the chart.
There’s an easy way to improve this.
Making an ONS embed responsive
At the ONS, we use a javascript library called pym.js to make charts and interactives responsive.
This means that the interactives re-size and re-shape to fit any screen they’re displayed on.
Instead of using just the iframe code, you could try using the following.
The only bits that you need to be change are what you’re calling it (in the example below we’ve called it “example”) and the URL of the visualisation you’re embedding.
For this to work, your content management system will need to allow inline scripts. If you’re not that confident using a CMS you might want to ask your developer or web support team for some advice and help.
<div id='example'></div>

<script type='text/javascript' src='https://cdn.ons.gov.uk/vendor/pym/1.3.2/pym.min.js'></script>

<script>

var pymParent =
new pym.Parent('example', 'https://www.ons.gov.uk/visualisations/dvc1786/app/index.html', {});

</script>
Code breakdown
Let’s break the code down into sections:
<div id="example"></div>
This is creating a <div> , which is used as a container for HTML elements. We’re giving it an “id” of “example” but you can call it whatever you need to. If you’re using more than one interactive on the same page, you’ll need to give each one a unique “id”.
<script type="text/javascript" src=" https://cdn.ons.gov.uk/vendor/pym/1.3.2/pym.min.js "></script>
This is loading the pym.js script from the ONS website. You can keep this bit exactly the same and use it whenever you want to embed one of our responsive interactive tools, maps or charts.
You could also make a copy of pym.js to host on your own server by visiting nprapps.org, where you can find more ways to use it and see examples of how other websites have done so.
<script>

var pymParent =
new pym.Parent('example', 'https://www.ons.gov.uk/visualisations/dvc1786/app/index.html', {});

</script>
This first bit:
var pymParent =
new pym.Parent('example',
is telling pym.js that the page where we are embedding the interactive is the “parent” . We’re using the div id we made earlier (“example”) to say where we want the interactive to go.
The next bit will be familiar as it’s the link to the visualisation:
'https://www.ons.gov.uk/visualisations/dvc1786/app/index.html'
This is what is known as the “child” page. You can get these links under our visualisations on our website.
The final bits of code:
, {});

</script>
are just to say that we are not using any optional extras and to close the script.
Try it yourself
If you want to practise and see how it all looks, try opening a plain text editor like Notepad, write some text and then paste some of the code.
Save it as a .html file extension (File>Save as>filename .html), not as a .txt extension.
Then, open it in your browser and see what happens when you make the window smaller.
We believe this method should work for most platforms.
If you find it doesn’t, and you want to be able to embed our interactive data visualisation, please get in touch with us at digitalcontent@ons.gov.uk and let us know what issues you’re having.