Publishing with the Integrated Data Programme
The Integrated Data Programme – Dissemination (IDP-D) project, part of the Integrated Data Programme, aims to build a platform where consumers of open government data can find and download data in a way that is friendly for both humans and computers. We are building tools to break down the barriers between individual spreadsheets so that it’s easier for everyone to analyse government data without struggling through many of the problems that occur when trying to compare data published by different organisations.
The guiding principle of our work is that if we can bring data together in one place in a standard format, then we can save other groups from having to find the time, effort and skills necessary to do this for themselves. With time, we might also be able to stop data consumers from making some of the same mistakes that we sometimes make when joining data together.
Our approach is to take existing open data and to transform it to a standard structure which we publish on a central website as 5* Linked Open Data. We make use of common, open standards including the CSVW standard, RDF, qb/SDMX, SKOS and DCAT.
How We Do It
The CSV on the Web (CSVW) standard is central to our process. It builds on the familiar CSV format and adds the capability for us to describe and annotate the published data. CSVW brings together both data and its metadata in a format which is easy for anyone to publish.
“CSV is a popular file format for tabular data. CSV on the Web is a World Wide Web Consortium (W3C) standard for describing parts of tabular data, including cells, rows and columns.
By using CSVW, government organisations can:
– more easily process CSVs into an annotated data model
– make CSVs easy to share and collaborate on
– make CSVs machine-readable”
Government Digital Service Guidance on using the CSVW standard
Our process starts with business analysts scouring a myriad of government data producers’ websites to find suitable datasets to upload to our platform. We find that most publishers release data as spreadsheets.
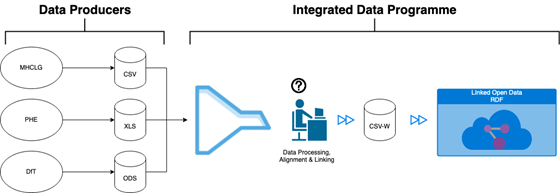
Datasets are published by data producers. The IDP-D team transforms them into standardised, machine readable CSVW files and uploads them to our Linked Open Data platform.
Once a dataset has been selected, a data engineer and data manager within the IDP-D team get together to decide on the best way to structure the spreadsheet’s data in our system and then create a basic CSVW without much metadata. This usually involves the data engineer meticulously writing a Python script to map the data structure in the spreadsheet into the Tidy Data format. Using a tidy data structure makes it easier to filter and perform further analysis with the data and is very popular amongst statisticians in the R community.
Next, the data manager will start reading all of the footnotes, appendices and related publications to get an understanding of what the data represents. We look for things such as what’s being measured, what the units of measurement are, what identifying information each record has and whether some data is preliminary or has been redacted.
The data manager then compares this spreadsheet with other similar datasets to see if there are common definitions which can be shared; for instance the spreadsheet may make use of a standard code-list such as the UK SIC 2007. If we can use standard definitions then we can make it easier to compare datasets. For instance we might be able to make it clear that the Agriculture category in one dataset is exactly the same concept as the Agriculture category in another dataset. Sometimes we can even provide mappings between two set of definitions where concepts don’t perfectly match up. This part of the process is often the trickiest but it is key to ensuring that datasets are linked together and placed in the correct context.
All of the data manager’s decisions on metadata are reported back to the data engineer who makes any final changes requested by the data manager and generates a CSVW which binds together the standardised data and its metadata.
Finally, the CSVW is uploaded to Swirrl’s PublishMyData platform where it can be explored by users or queried using SPARQL. In the future, it’s reasonable to expect that statisticians will program their Reproducible Analytical Pipelines and commercial firms will configure their applications to download the latest data from the IDP platform so that they don’t have to deal with messy spreadsheets.
Challenges
Needless to say, the above explanation of the IDP linked data pipeline contains a few simplifications and glides over a number of the problems that we have stumbled upon in the process of linking existing open government data. So let’s discuss some of those problems.
One great thing about Excel is that it gives you the freedom to express and encode information in the way that feels right to you. However, the flip side of that is that it makes it harder for a computer program, and our team of data engineers, to extract that information. For instance, many data producers use characters like * to specify that certain values are preliminary and subject to revision, but we have found that more and more producers are choosing to specify that italic or bold text represent the same thing. We have to spend time and effort upgrading DataBaker, the tool we use to convert human-friendly tables into tidy data, in order to extract the many different ways publishers can encode this information. Life would be a lot easier if there were consistent ways publishers used to represent this information.
In a similar vein, it is often the case that metadata (data describing the data) can be difficult to find. Sometimes it makes its way into spreadsheets as footnotes, but it can often be found outside the document somewhere on the publisher’s website. As a data manager, I know for myself how difficult it can be to pull together all of this information and how sometimes you’ll find it in a place you’re not expecting to. Information like which codelist is being used to break-down data are often hard to find; is the West Midlands the NUTS region in this dataset or is the county? Yes, sometimes we can probably work this out from the context, but it isn’t always that simple. Figuring out what the data means can often be difficult when publishers describe metadata in an inconsistent and ad-hoc fashion.

West Midlands the NUTS region (left) and West Midlands the county (right) – which one does “West Midlands” in this spreadsheet refer to?

Another problem that we experience periodically is that some data producers change the layout of their spreadsheets when they update data. This may not be too big a problem for a human, but it means that our data pipeline isn’t able to extract the data reliably. Every time that spreadsheet formats change, our team of data engineers have to go back and rewrite their scripts to account for these changes. This could end up being a big problem. You could imagine a statistician building their Reproducible Analytical Pipeline so that it extracts data from a published spreadsheet only for the format to change, potentially pulling through the wrong data into the statistician’s analysis; perhaps someone would notice the error, but maybe no one will. When it comes to machine readability, consistency in publishing format is key.
The Future
Data publishers usually know the methodology used to record and analyse their data. They are typically aware which code lists they use to break-down data and generally already have access to data in a machine friendly format from databases or the original tidy data used to generate the human-friendly spreadsheet. Data publishers certainly have more knowledge about their dataset than I as an IDP-D data manager do. And when you consider how much time and effort that IDP-D currently spend understanding and transforming datasets, it becomes clear that our current approach is simply not scalable. So what do we do?
It’s clear that we need to involve data publishers more in the process both to make use of their knowledge as well as to better scale the process of creating these metadata-heavy CSVWs. So how do we get them involved? Well, the IDP-D team have been busy developing and improving the tooling that we use to transform data from spreadsheet through to CSVWs that fit into our linked open data platform. Currently the tooling is more complex than it needs to be, so we’re working to simplify it so that all data producers will have to do is provide a spreadsheet together with a configuration file that describes their data.
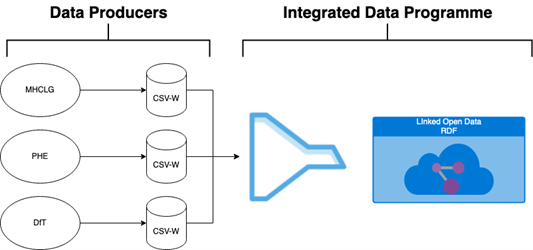
In order to scale up, we plan to shift the generation of CSVWs from the IDP team back to data producers. They know their data best.
Given how notoriously complicated the linked data space can be, creating the tooling for data producers in a way that is user-friendly is a difficult task and is one which we’ll achieve by taking small steps in the right direction. Initially, our tooling might only be available as a tool that is suitable for statisticians who are comfortable with writing basic code, but eventually we plan to take the tooling further to make it a point-and-click exercise to take data from your spreadsheet all the way through to a fully defined CSVW which is ready to be part of the 5* web of linked data.
What Can I do to Help?
The area where we could use the most help at the moment is from data producers themselves. Whilst we don’t have the tools ready for them to start producing fully-fledged CSVWs just yet, there are a few things that they can do to standardise what’s currently being produced:
- Consider offering your data in the machine-friendly TidyData format along side your existing publications. It could just be an extra sheet in your document.
- Try to avoid changing spreadsheet layouts if it can be avoided.
- Perhaps move towards using Reproducible Analytical Pipelines to ensure your outputs are consistent. Many departments have a RAP champion; you can find out more about yours here.
- Ensure that your datasets are self-documenting.
- Explicitly mention which code-lists you are using, and if you can, make sure to specify which version you’re using.
- If you use your own code-lists or reference one which isn’t publicly published, consider including a copy as a sheet in your document.
- If you do use code-lists, consider publishing the code alongside the name to unambiguously pin down exactly the entity you’re referencing.
- Ensure any caveats to data are mentioned alongside the data.
Further Reading
- CSV-W Maturity Levels – with examples.
- Government Statistical Service – Harmonisation
- End to end alpha
- Government Statistical Service – Guidance – Connected Open Government Statistics (COGS)
- We are family – working with Swirrl
- Mapping data ecosystems: Government Statistical Service (GSS) Alpha Project
- Dataset Families: our work with ONS on the GSS Alpha Project
- Connected Open Government Statistics: What’s the Point?
- Swirrl’s Linked Data Frames R Library