Census maps: Explore, download and share data down to a neighbourhood level
Our new Census maps interactive tool lets you explore Census 2021 data across England and Wales right down to a local neighbourhood level.
Census offers us data at a level of granularity not often available. Making sense of this can be difficult and time consuming. It requires specialist knowledge, dealing with large files and specialist software. We’ve created these maps so you can easily explore and see differences between neighbourhoods.
This blog post is here to help you get the most out of Census maps, including:
- How to find the specific data and geographic area you are interested in.
- How to share and embed maps of your own area.
- How to get hold of the source data.
Find your own area
When you visit Census maps, by default “England and Wales” is selected. This means that for any topic you choose, you should initially see the data for England and Wales as a whole.
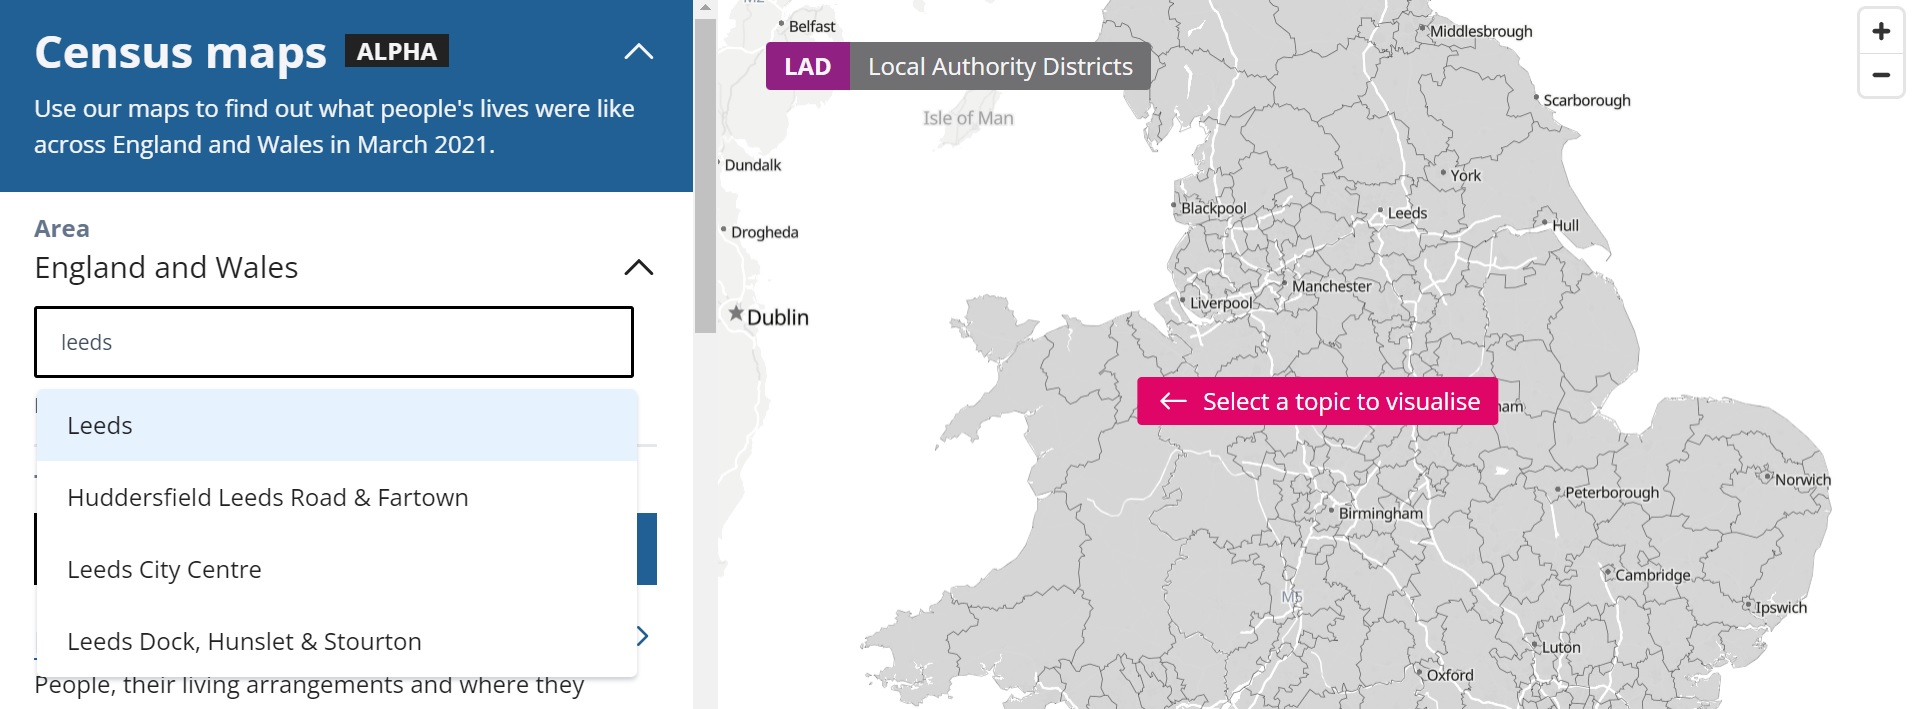
You can find your own area either by panning, zooming, and clicking on the map, or by clicking on the current selected area in the side panel, and then typing an area name or postcode into the search box. Typing a name will allow you to find local authorities and MSOAs, while typing a postcode will zoom you to that part of the map.
MSOAs (or middle-layer super output areas) are statistical areas home to between 5,000 and 15,000 usual residents. The names used for these areas in Census maps were compiled by the House of Commons Library.
For many topics, you can go even more local and down to Output Areas. These are the smallest statistical geography that data are released for, with each area typically home to between 100 and 625 usual residents.
Note: The maps use building shapes to visualise the data at Output Area and MSOA level, but the data covers the outlined area rather than individual buildings.
Select a topic
At the time of writing, Census 2021 data have so far been released for variables on the topics of demography and migration. We will add more topics as they become available.
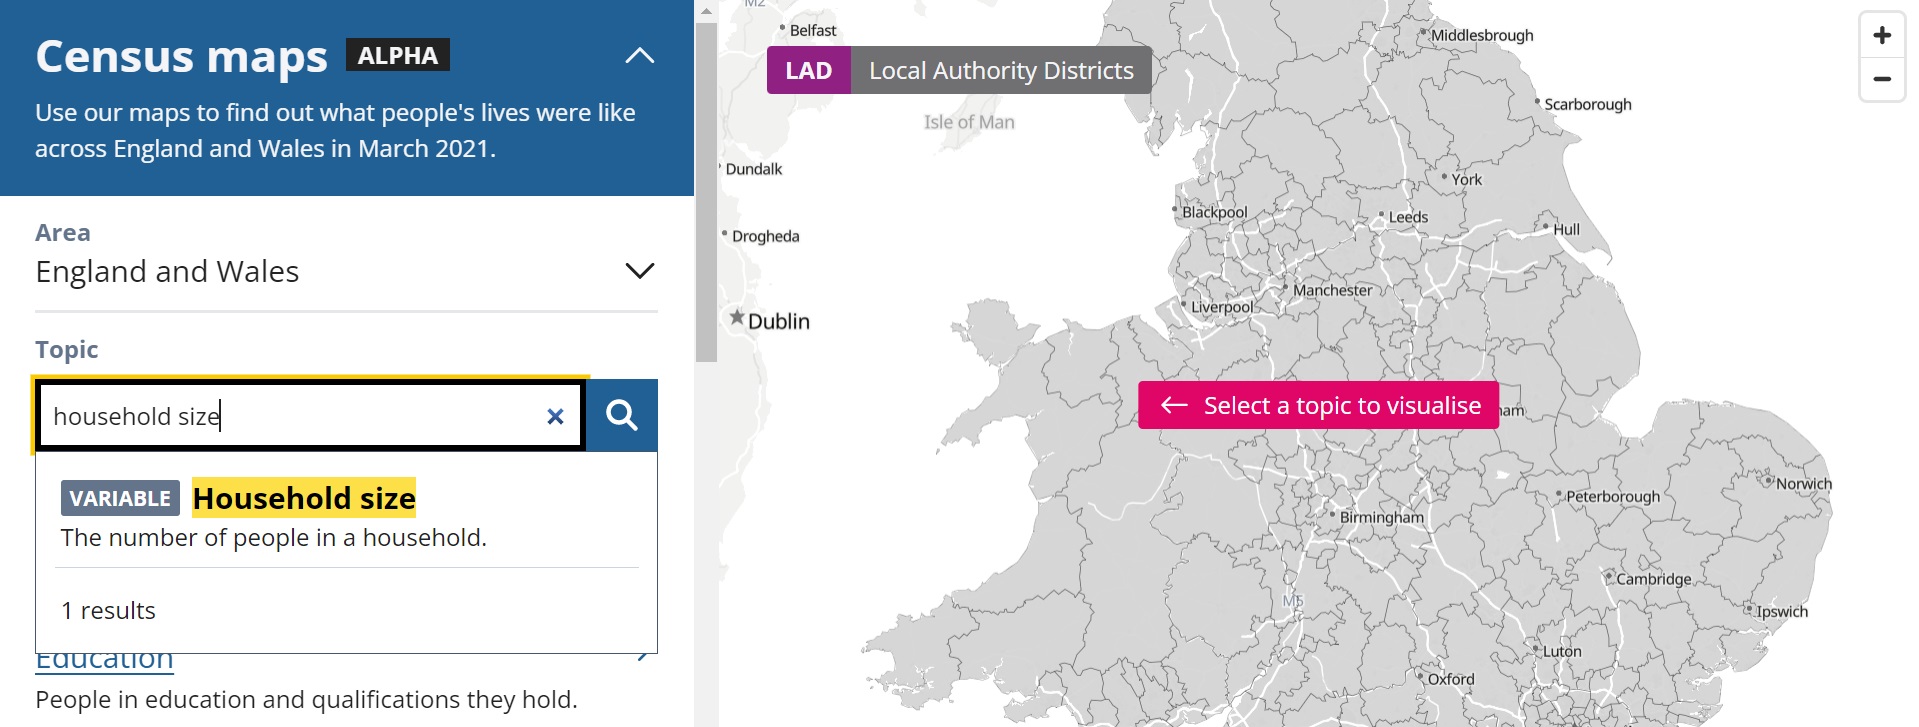
To select your topic of interest from those currently available, you can either use the topic search box (eg. Type in “household size”), or you can navigate the available topics via the categories linked below.
Once you have chosen a specific data topic (or “variable”), you can then choose from the specific “categories” within it. For example, if you chose “household size” as in the example above, you could then select from “1 person in household”, “2 people in household” etc.
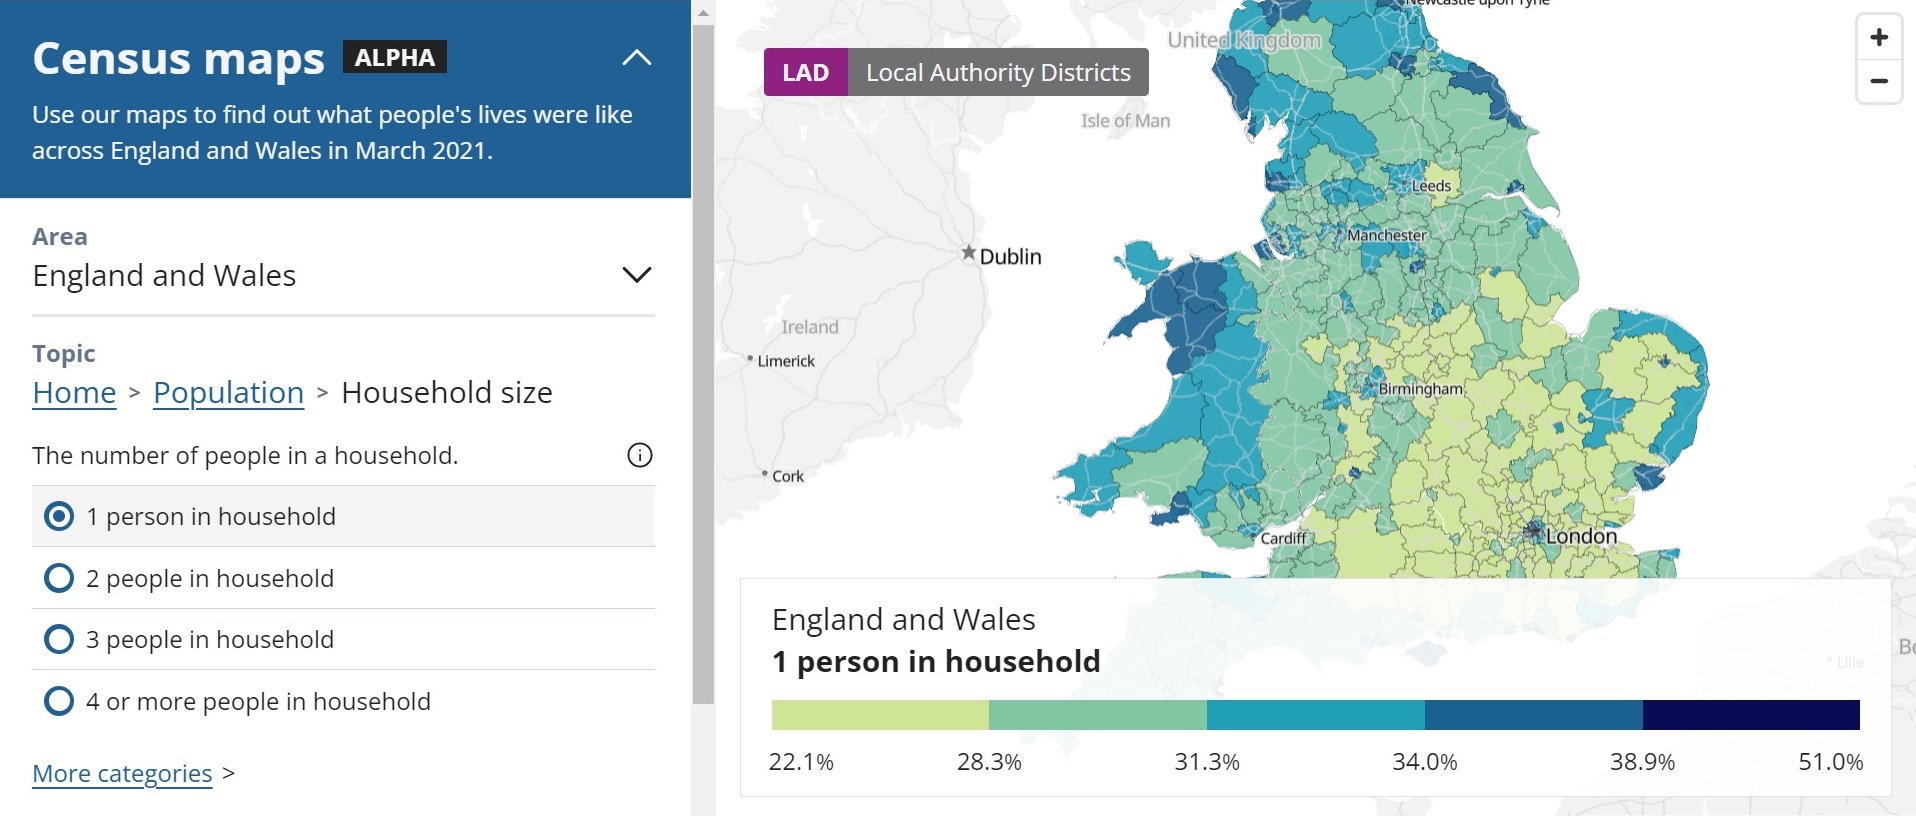
The resulting map shows the percentage of people or households in an area that fit within the selected category. In the example above, this is the proportion of one-person households as a percentage of all households in each local authority area. The darker an area is, the higher its percentage. You can zoom in on the map to see neighbourhood level data.
In the case of some topics, you will see a “more categories” link at the bottom of the list, which allows you to access more detailed data.
Share and embed
If you would like to share your selected data topic/category and area with other people, you can simply copy the URL from the address bar. The URL updates whenever you select a data topic or place, so someone visiting the same URL will see the same selections that you can see.
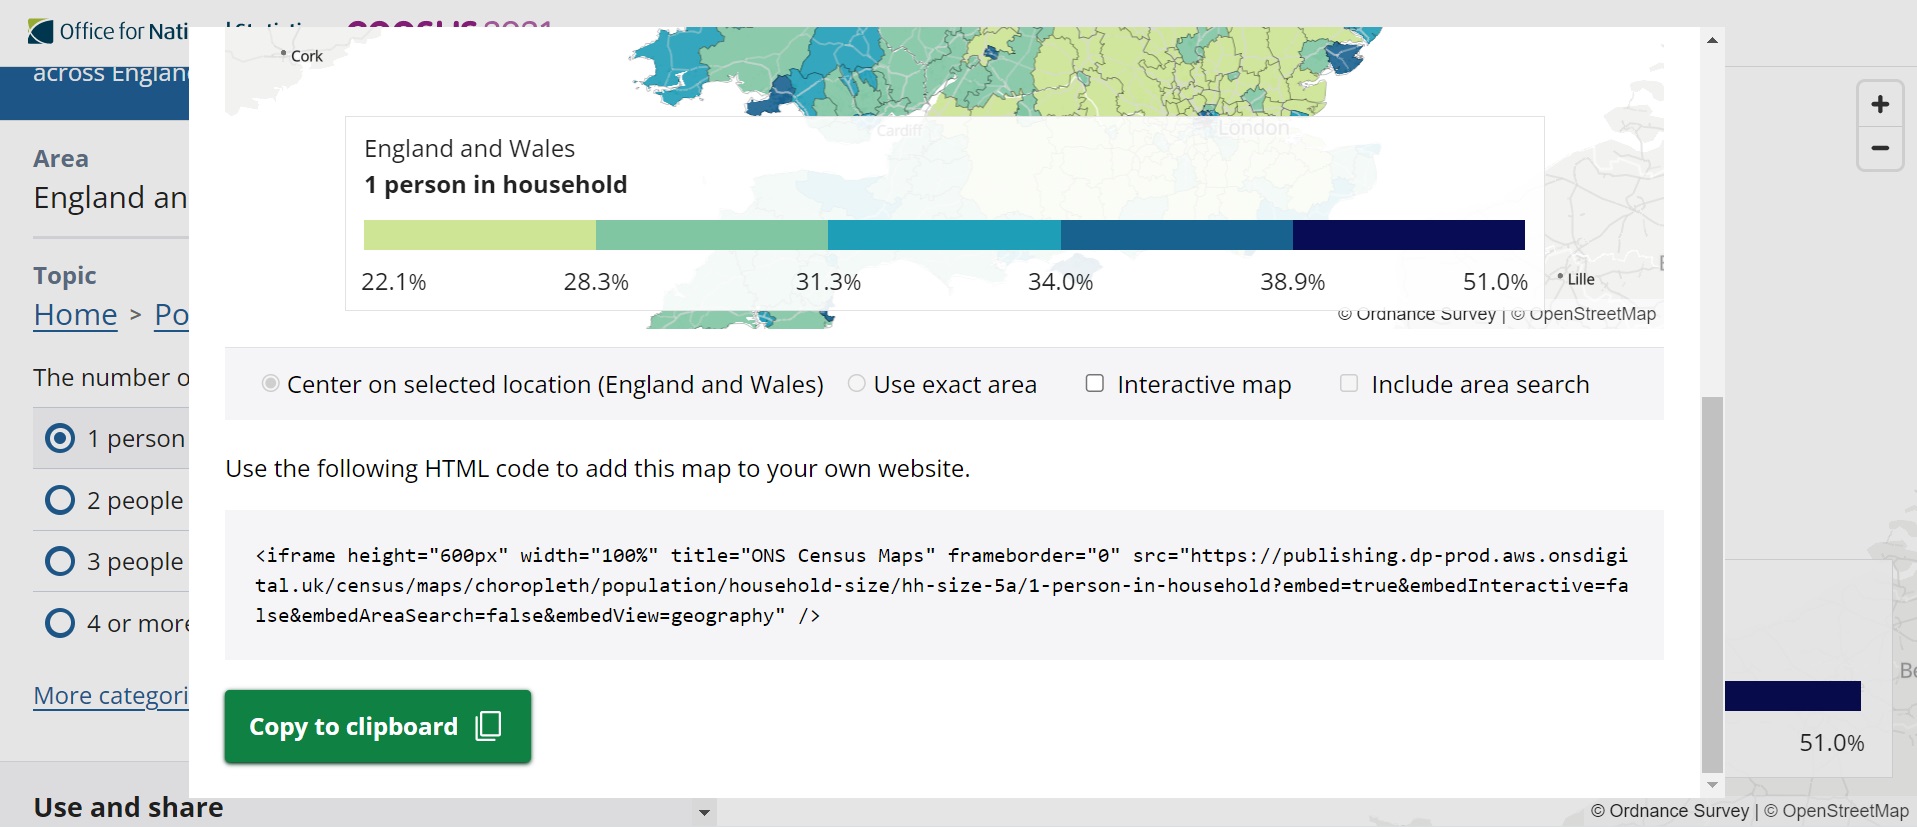
You can also embed Census maps in your own website by clicking the “embed this map” link at the bottom of the side panel, and then copy-pasting the HTML code into your website. Note that your website must allow you to write HTML code and to include “iframes” within pages.
Download data
Whenever you select a data topic, you should see a “download data” link at the bottom of the side panel (next to the “embed” link). Clicking this link will bring you to the relevant Census 2021 dataset on the ONS website.
Demography and migration univariate data are available via our website. The data are provided as downloadable excel spreadsheets in the first instance, with APIs available soon via the NOMIS and ONS websites.
Technical information
All of the software and tools used to create Census maps are free and open source. The geographic boundaries and Census 2021 data are available under the UK Open Government Licence.
The front-end app was created using Svelte Kit and Maplibre GL JS. The app has no back-end database, and instead runs off flat data files that have been pre-processed from raw Census 2021 data.
The vector map tiles were processed using Tippecanoe from geographic boundaries available on the ONS Open Geography Portal. The building footprints seen on the map are derived from the Ordnance Survey’s Open Zoomstack, and the background mapping is derived from OpenStreetMap using the OpenMapTiles Tools library.
Future developments
You can expect further additions and improvements to Census maps over the coming months.
Firstly, further datasets will be added to the tool as and when they are released. You can view the Census 2021 topic summary release calendar to see when you can expect to find new data on Census maps.
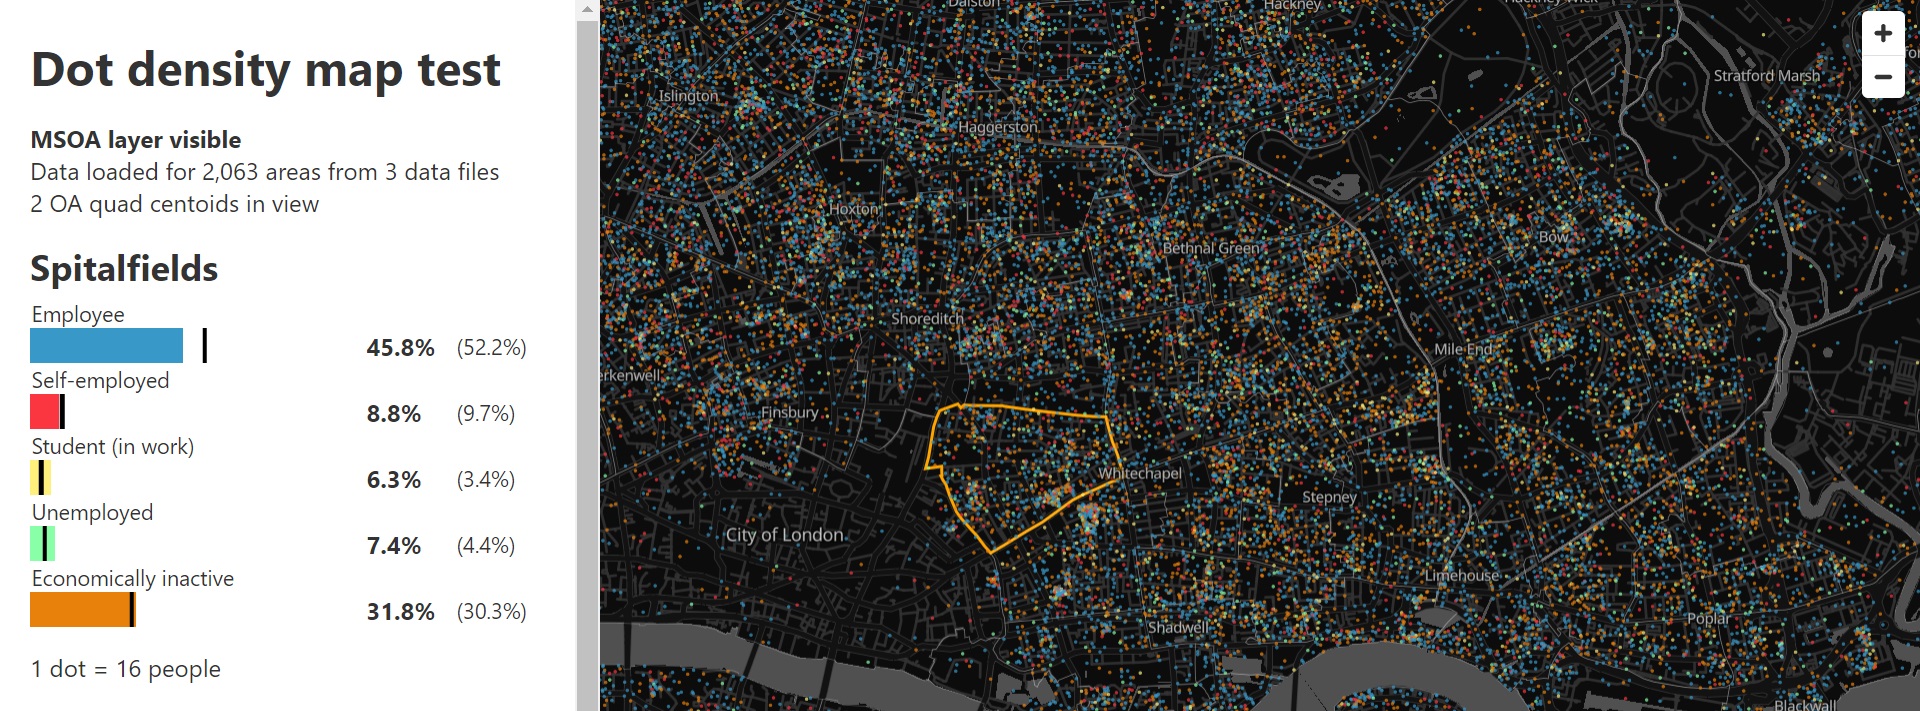
Secondly, we are aiming to add further map modes to the tool. Our intention is for these to include 10-year change from Census 2011, and dot density maps for selected data topics.
In addition, we are working on several other interactive tools for exploring and better understanding Census 2021 data. These include a “Build a custom area profile” tool that will allow users to view data for their own custom geography drawn on a map, and a series of “What’s changed in your area” reports highlighting significant changes from the previous census in hundreds of individual local authority areas.
Share your thoughts
If you have any thoughts or ideas that you would like to share about Census maps or any of the above-described tools, do not hesitate to get in touch. We’d also be interested to hear if and how you make use of Census maps in your own work. You can reach out to us at digitalcontent@ons.gov.uk or via the feedback form on the ONS website, or contact me directly via Twitter.