How to customise an embedded interactive

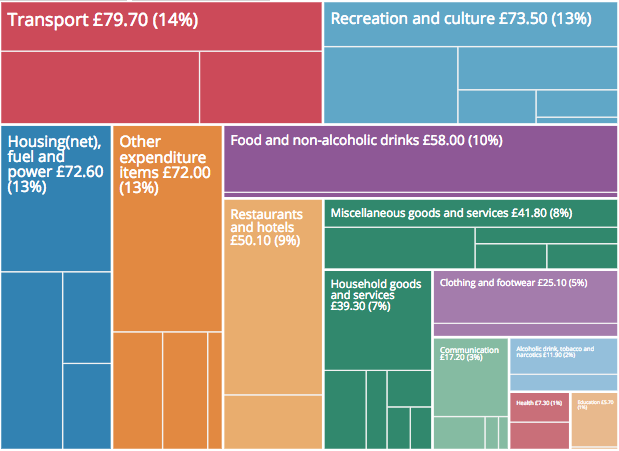
The 2017 Family Spending data was released today. For the past three years the bulletin has been accompanied by an interactive treemap, which visualises all components of household expenditure. This treemap is embeddable allowing it to be easily syndicated by anyone interested in the data. Embedding the interactive is straightforward and Henry Lau has written a great post on how to do this.
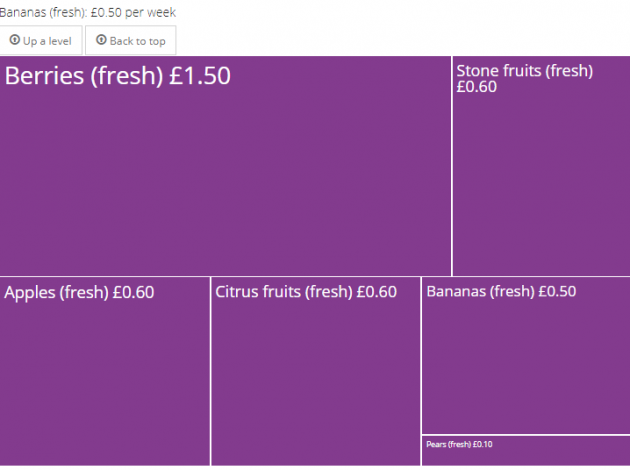
The treemap also creates custom urls, which can be used to show particular views. For example, say I’ve written some text about how much households are spending on bananas a week, it would be great to include a view of banana spend. I could do this by taking a screenshot of the treemap.

However, this removes the context of how much people spend on other items. What might be a better solution is to embed the whole treemap and be able to show people how you reach the view that specifically focuses on bananas.
If you visit the page where the treemap is hosted, https://www.ons.gov.uk/visualisations/dvc465/treemap/index.html, you’ll notice that as you click on a section to zoom in some extra code appears in the url. Clicking on the transport section gives #c7, communication is #c8 and clicking on the food and non-alcoholic drinks section all the way down to bananas gives #c1/c1_1/c1_1_19.
Adding this code to the end of the standard url specifies the view that you want people to see. For example, try visiting: https://www.ons.gov.uk/visualisations/dvc465/treemap/index.html#c1/c1_1/c1_1_1
Therefore, to share a custom view, all you need to do is navigate to the view that you’d like to share and copy the full url including all characters after the hash. This url can then be used as it is to share your view via a link or it can be pasted into the embed code to iframe a custom view of the treemap into your own page. For example:
<iframe width=“100%” height=“800px” src=“https://www.ons.gov.uk/visualisations/dvc465/treemap/index.html#c1/c1_1/c1_1_1“ scrolling=“no” frameborder=“0”/>
When the treemap loads it will look something like this:

Some examples of different views are:
Mobile phone accounts
https://www.ons.gov.uk/visualisations/dvc465/treemap/index.html#c8/c8_3
Beer and lager
https://www.ons.gov.uk/visualisations/dvc465/treemap/index.html#c2/c2_1/c2_1_3
Newspapers
https://www.ons.gov.uk/visualisations/dvc465/treemap/index.html#c9/c9_5
Responsive embedding
All interactive content produced by ONS is responsive, meaning it resizes for different window sizes on mobiles, tablets and desktops. We use a small javascript library called pym.js to make this possible.
To embed a responsive graphic, you need to use pym on the site you’re embedding on (the parent) and the page you’re embedding (the child). This is quite simple to do if you can add scripts to your page. Again, you can read more about using pym.js in Henry’s blog and also see more data visualisation examples using this approach on Visual.ONS.
How do you embed your content?
We hope that embedding our content elsewhere is straightforward but realise there’s more than one way it can be done. Do you use a different method to embed? How can we make it easier for you to syndicate our content? Let us know at digitalcontent@ons.gov.uk