A year in social: increasing traffic from our social media posts
I thought I’d share news of work the social media team have been helping coordinate over the past year. This has contributed to a significant increase in traffic to Office for National Statistics (ONS) related products – raising awareness of our organisation and the statistics we produce.
From 23 November 2017 to 23 November 2018 – compared with the same period the previous year – we’ve seen an increase of 61,000 more clicks through from social media posts we’ve published on Twitter to the ONS site, blog posts or other ONS-related products. On Facebook we’ve seen an increase of 13,000.
Less is more
When I joined the organisation in October last year, one of the things I noticed was the volume of posts going out from our social media channels. Taking a look at analytics for engagement I could see which content performed less well, and fed back to business areas how we could concentrate on developing the better performing ones. Engagement is signified by how many shares, likes, replies and link clicks posts receive.
I worked with Labour Market and Migration Statistics Quarterly Report teams to gauge reaction from previous posts and developed a benchmark for engagement. Fewer than 50 engagements for a post suggest that the content was not as appealing to users as it could be. The reason was probably because the content wasn’t providing enough insight. So, I advised to cut out content which wasn’t providing pertinent information, which resulted in fewer posts but ultimately more click-throughs.
We also achieved higher engagement through the visually appealing content our colleagues in the design and data visual teams created, which has become increasingly more animated and aesthetically appealing over the year.
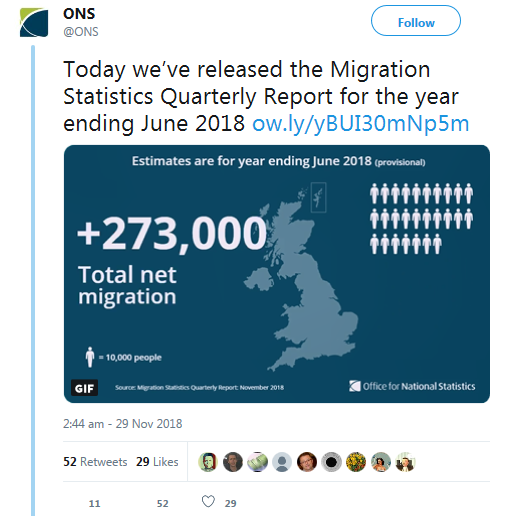
In addition, our data visual team built an internally-used automated gif maker for the migration release. This is a tool which enables a user to enter figures and it generates an animated gif of the statistics for use on social media. Since using these animated gifs we’ve seen a substantial increase in engagement and reach.
Making ends meet
In July, the first tweet promoting our article Making ends meet: are we living beyond our means was the most successful post of all time for @ONS in terms of overall engagement.
The post received more than double the retweets and likes and over double the engagement and impressions in comparison with the second most successful of all time (a post on disposable income for the poorest fifth of households).
Collectively the six tweets for the making ends meet promotion reached nearly half a million people and were shared 1,877 times. The tweets were picked up by AP and featured on Yahoo Finance as an embedded Twitter thread within the article (a thread is a series of tweets linked together).
Baby names
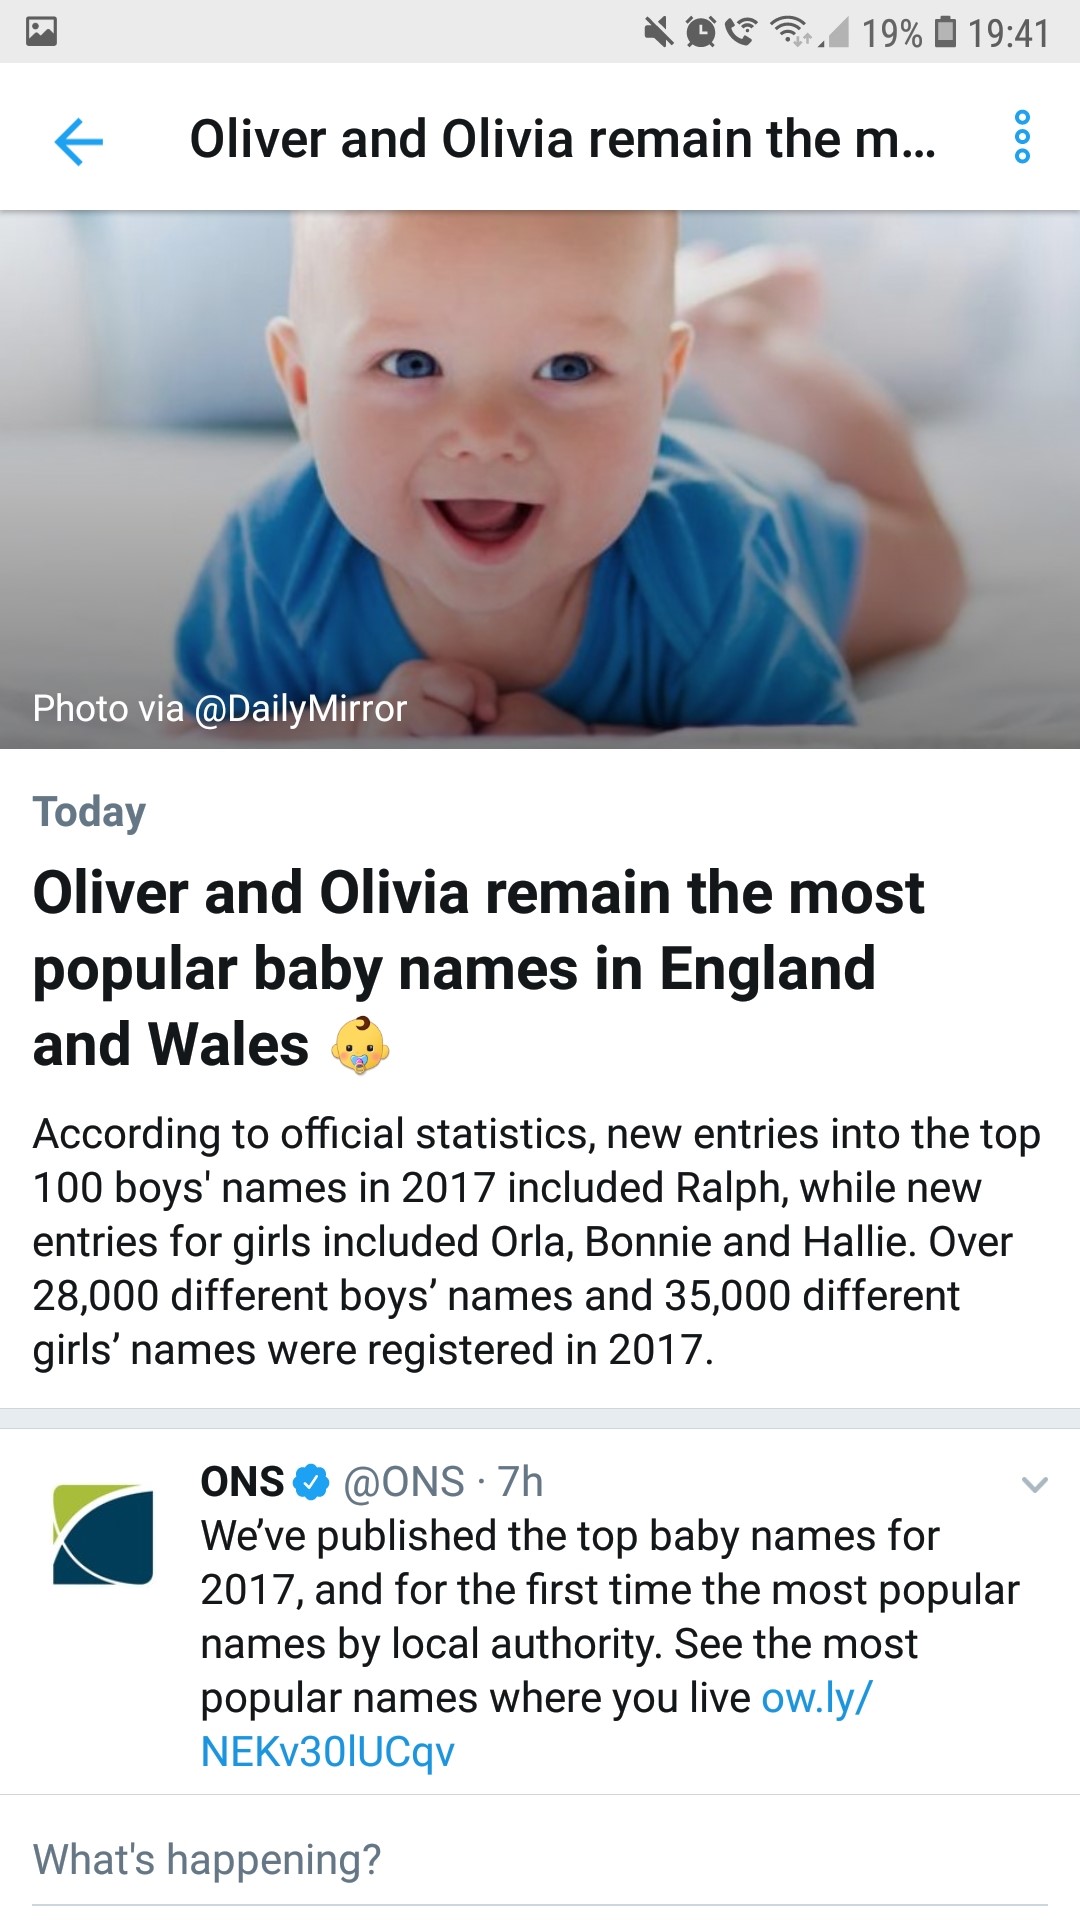
Another example of highly engaging content this year is our baby names output. ONS baby names data is always a draw for people and this time around we wanted to do something special on social. Working with our colleagues in digital content (data journalists and design), the media relations office and business area for the release, we created posts around finding popular baby names connected to people’s postcodes. The social media content received extremely high click-thoughts to the site.
The posts were also picked up by Twitter, who curated them in the “What’s happening?” section, and featured there for two days around the release. Our tweets were included as was a few others, most notably Theo Paphitis of Dragon’s Den fame discussing the popularity of his name. This curation saw huge boosts in URL clicks – one post alone saw over 5,000 clicks.
Tweeting statisticians and the budget
Other successful content this year includes the content for the Autumn Budget. We organised eight Tweeting Statisticians (a network of statistician leads from important areas), their team members and MRO to live tweet related stats alongside the Budget announcements.
We had 17 people take part both virtually and in the office, which was coordinated effectively via Skype (via the chat function, not audio!) and our social media platform Hootsuite.
On the day of the budget six statisticians gained 122 followers, and received 305 more engagements than the day before.
We’ve recently appointed a social media manager to help develop the network. He’s helping statisticians develop their content around releases, event days and interaction with users and influencers.
Improving your social engagement
If you’re interested in increasing your social media engagement, here are three steps to take for recognising and developing great content.
Benchmark
Look at engagement for your posts (use native Twitter if you don’t have a standalone analytics app) and establish what a benchmark for good engagement is – the average engagement is a good starting point.
Evaluate
Once you have a good engagement score, why are some posts not achieving this? Could it be the time you posted, the image used or is the copy unclear?
Build on content
Consider developing scores not just on what “good” looks like, but “very good” and “excellent” – these benchmarks will show you which content works well with your audience, enabling you to further develop engaging content.