How to make a Census 2021 data profile for your local area
Build a custom area profile is a simple tool that allows you to create a Census 2021 data profile covering any area in England and Wales, including one that you draw for yourself on a map. This blog post offers and introduction to the tool and how to use it.
Why this tool exists
Since 2001, census data for England and Wales has been published down to a neighbourhood level, broken down into around 180,000 statistical “output areas” that can be added together to provide data for any larger area. But this can be a painful process!
Up until now, getting data for your own custom area required an ability to work with GIS mapping software, to download large amounts of data, and to wrangle that data using spreadsheets or code.
Build a custom area profile allows you to simply select an area on a map and get the data directly, skipping all the complicated middle steps. The available Census 2021 data topics include total population, age, national identity, the types of homes people live in and the jobs they do.
Find an area on the map
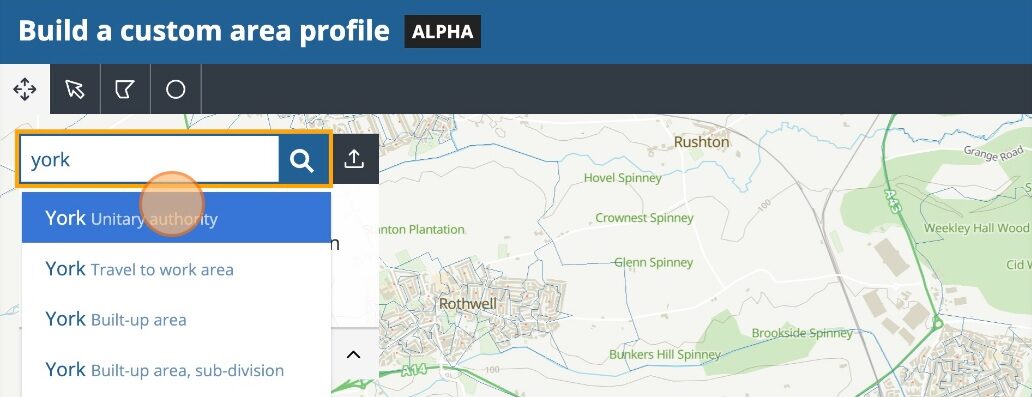
To find a ready–made area, just type an area name in the search box, for example “Birmingham”. The areas available include local authorities, wards, parishes, and built-up areas. Typing in a postcode will zoom to the area where that postcode is found.
Drawing tools
To draw on the map, select one of the tools from the top-left menu. The options are:
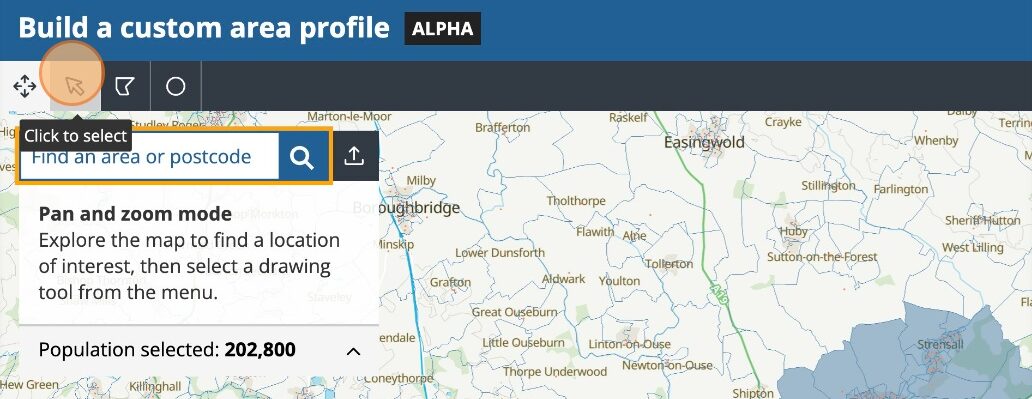
Click to select
Click an individual area to add or remove it from your selection.
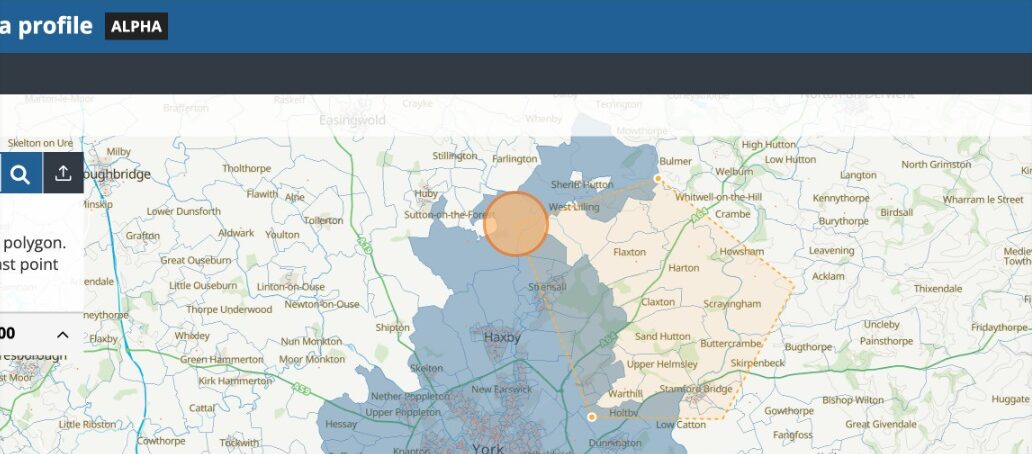
Draw a polygon
Click on the map to draw a polygon. Click again on the first or last point of the polygon to complete it. Note that areas on the map are selected only if their “population weighted centroid” (the small orange dots on the map) fall within the selected polygon.
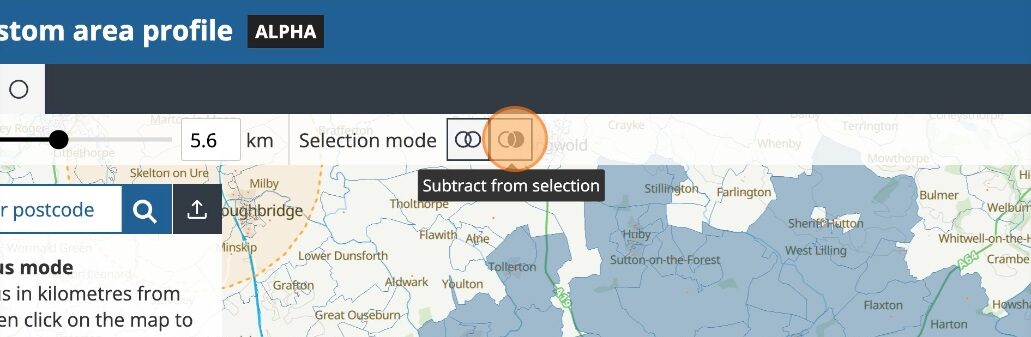
Draw a radius
Select a radius in kilometres from the slider in the menu, then click on the map to draw a circle. As with the polygon tool, areas will be selected on the map based on the position of their centroids.
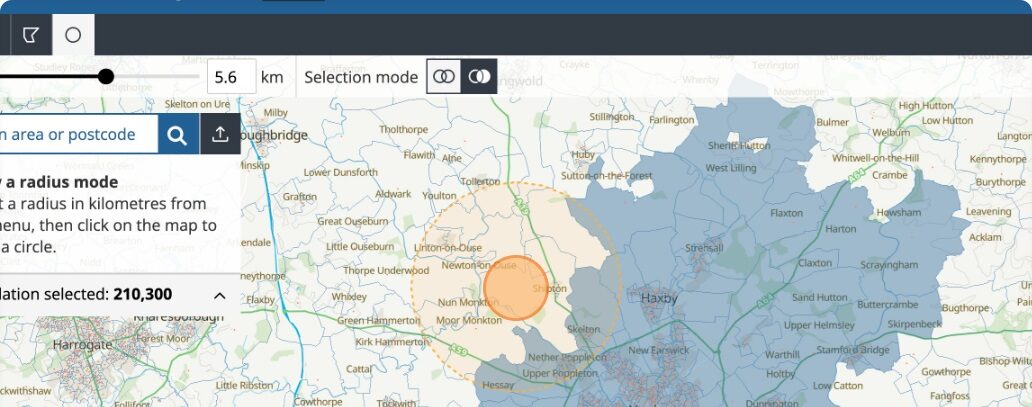
Note: The polygon and radius tools also have a “selection mode” toggle in the menu that can enable a “remove from selection” mode that subtracts the drawn area from the current selection (eg. If you want to create a hole within a selected area).
Clear and undo selections
You can undo the most recent selections that you have made by clicking on the “undo” button in the top-right menu.
The red “clear all areas” icon in the same menu can be used to remove all selected areas from the map. It is not possible to undo this action.
Save an area
Your current selected area should be saved automatically, so that you see the same selection when you return to the page.
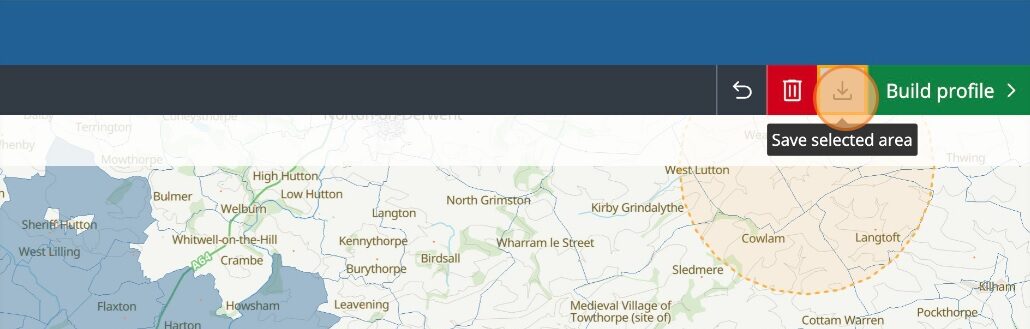
If you want to save an area for later use, you can click “save selected area” from the top-right menu. This gives you the option to name your area and save it as a GeoJSON file, or to simply copy a list of the GSS codes (eg. E00187682) for all the individual output areas that you have selected.
Note that it should be possible to load the GeoJSON file into any mapping software to see the boundary of your custom area.
Load an area
You can load any GeoJSON area file that you have previously saved from the tool. Just click on the “upload a saved area” button on the right of the area search box and then choose the file on your hard disk.
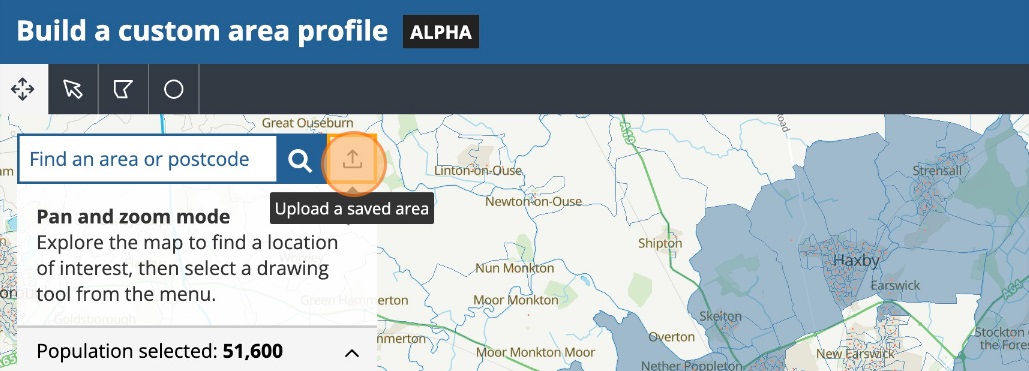
Note that it is also possible to upload a polygon saved from another GIS software. The format of the file must be GeoJSON, and should only contain a single feature/polygon. In the case of a geojson file with multiple features, only the first one will be loaded.
Start building a profile
When you have finished selecting your area, click the green “build a profile” button in the top-right menu. This will bring you to another page where you can select Census 2021 data topics for your area.
Name your area
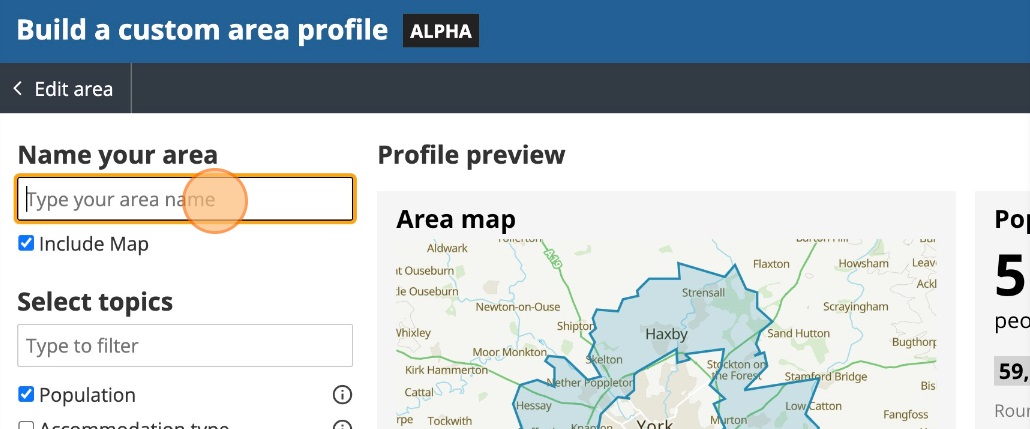
You can name your custom area by typing in the text box under the “name your area” heading. Changing the name will update the name on the profile automatically. If you started with a ready-made area, the name should already be in the box. You still have the choice to edit the name, for example if you made changes to the area on the map.
Select datasets
Initially, only a map of your area and its total population will be visible in your profile.
To add other topics, simply select from the list on the left of the page. You can filter the list by typing into the text box at the top, and expand the list by clicking the “show more” button at the bottom. More information on each topic is available by clicking on the “info” icon on the right of the topic name.
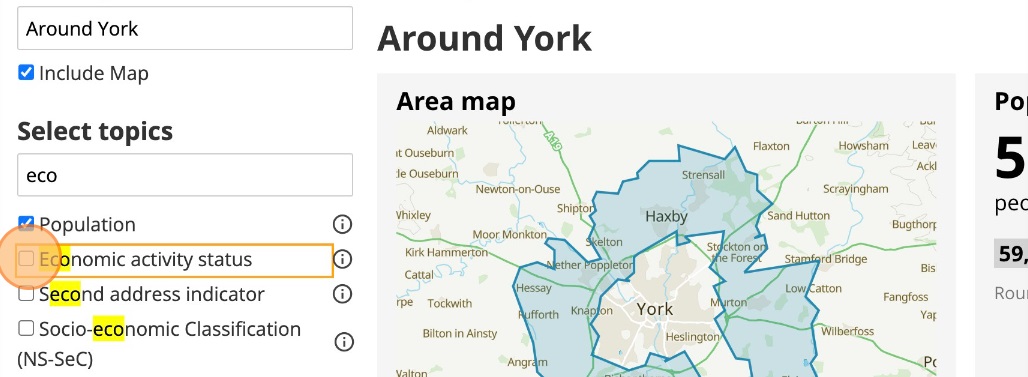
You have the choice to remove the map from your profile. It is advisable to include the map to be clear about the exact area that the data covers, especially if your profile is for a custom drawn area.
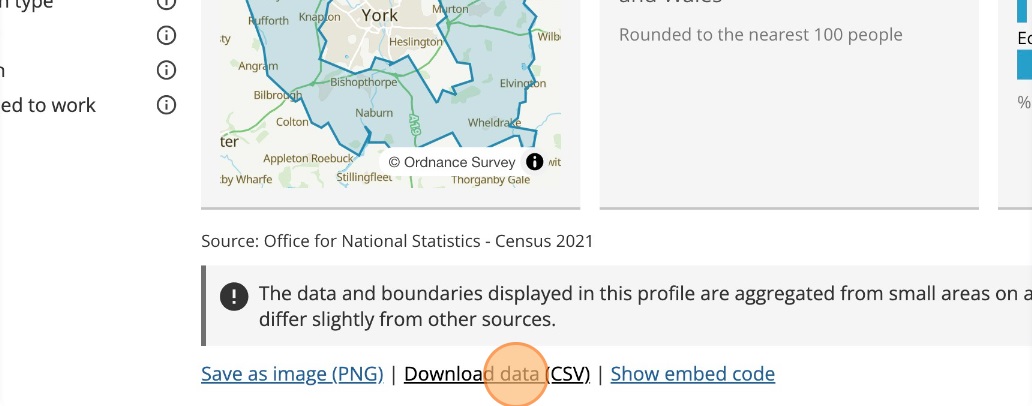
Download profiles and data
Once you have selected your topics of interest, you can download your area profile as an image (PNG), or download the data in a spreadsheet (CSV) using the links at the bottom of the page.
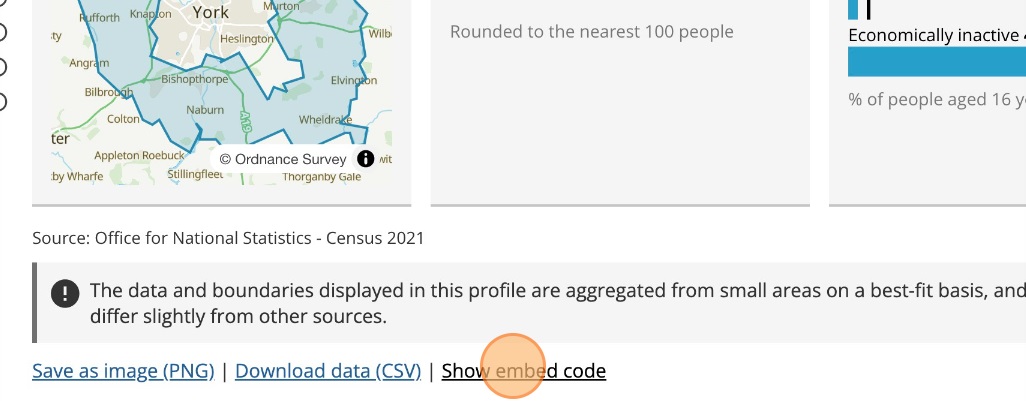
Embed a profile
If you would like to embed your custom profile on your own website, you can simply copy the embed code by clicking the “show embed code” link at the bottom of the page, and then clicking “copy embed code”.
Note that the embed code requires your website CMS to allow <script> tags. It utilises a script called Pym JS that allows the embedded profile to display correctly across all screen sizes. If you cannot use this type of embed code, it might be preferable to download the profile as a PNG image instead (see above).
Technical information
Build a custom area profile makes use of several Javascript libraries and frameworks, all of which are open source. The source code for the app itself can be found here on Github.
The overall app is built using the Svelte Kit framework. The map interface is made using Maplibre GL JS. Processing of geographies is handled by functions from Turf JS and Mapshaper.
The base map layer is Open Zoomstack from the Ordnance Survey, and the output area boundaries and centroids come from the ONS Open Geography Portal. The area search utilises boundaries and lookups from the same portal.
Census 2021 data is loaded from the Nomis API, which has the capability to add together data for “user defined” geographies – a list of GSS area codes – and to return data in the form of percentages.
Share your thoughts
Build a custom area profile is a beta product, which we intend to actively develop and improve over time. If you notice any bugs, or if you have any thoughts or ideas that you would like to share about the tool or other Census 2021 products, it would really help us if you could complete this short survey.
We would also be interested to hear if and how you make use of the tool in your own work. You can reach out to our team at digitalcontent@ons.gov.uk, or contact me directly via Twitter or Mastodon.