The data we use for content design at ONS
In my last post, I wrote about why data is important to the way we create and present content at ONS. Here I’m going to share the data we’re using, and the tools we use to gather and present that data. Everything here comes with a big “work in progress” caveat, so do let me know what you think in the blog comments or on Twitter.
The dashboard
The biggest challenge has been finding a simple, accessible way to share data about content. The best tool I’ve found for this so far is Google Data Studio. It’s free (well, as free as these things can be), and allows you to visualise data from lots of different places on one dashboard. You can even bring in data from your own spreadsheets, which I can see being very useful in future.
I’ve set up dashboards in Data Studio which cover the most useful analytics data to inform decisions about content design. Here’s the dashboard for a recent statistical bulletin on crime in England and Wales.
I will pare-back the amount of data we show here in time, but it’s working well as a conversation starter for now.
The dashboard can be tailored to report on individual pages fairly simply (though I’d like it to be simpler!). Here’s a blank template if you’d like to make a copy and create your own – you’ll need to sign up for Data Studio, and have access to your Google Analytics and Search Console accounts to get everything working.
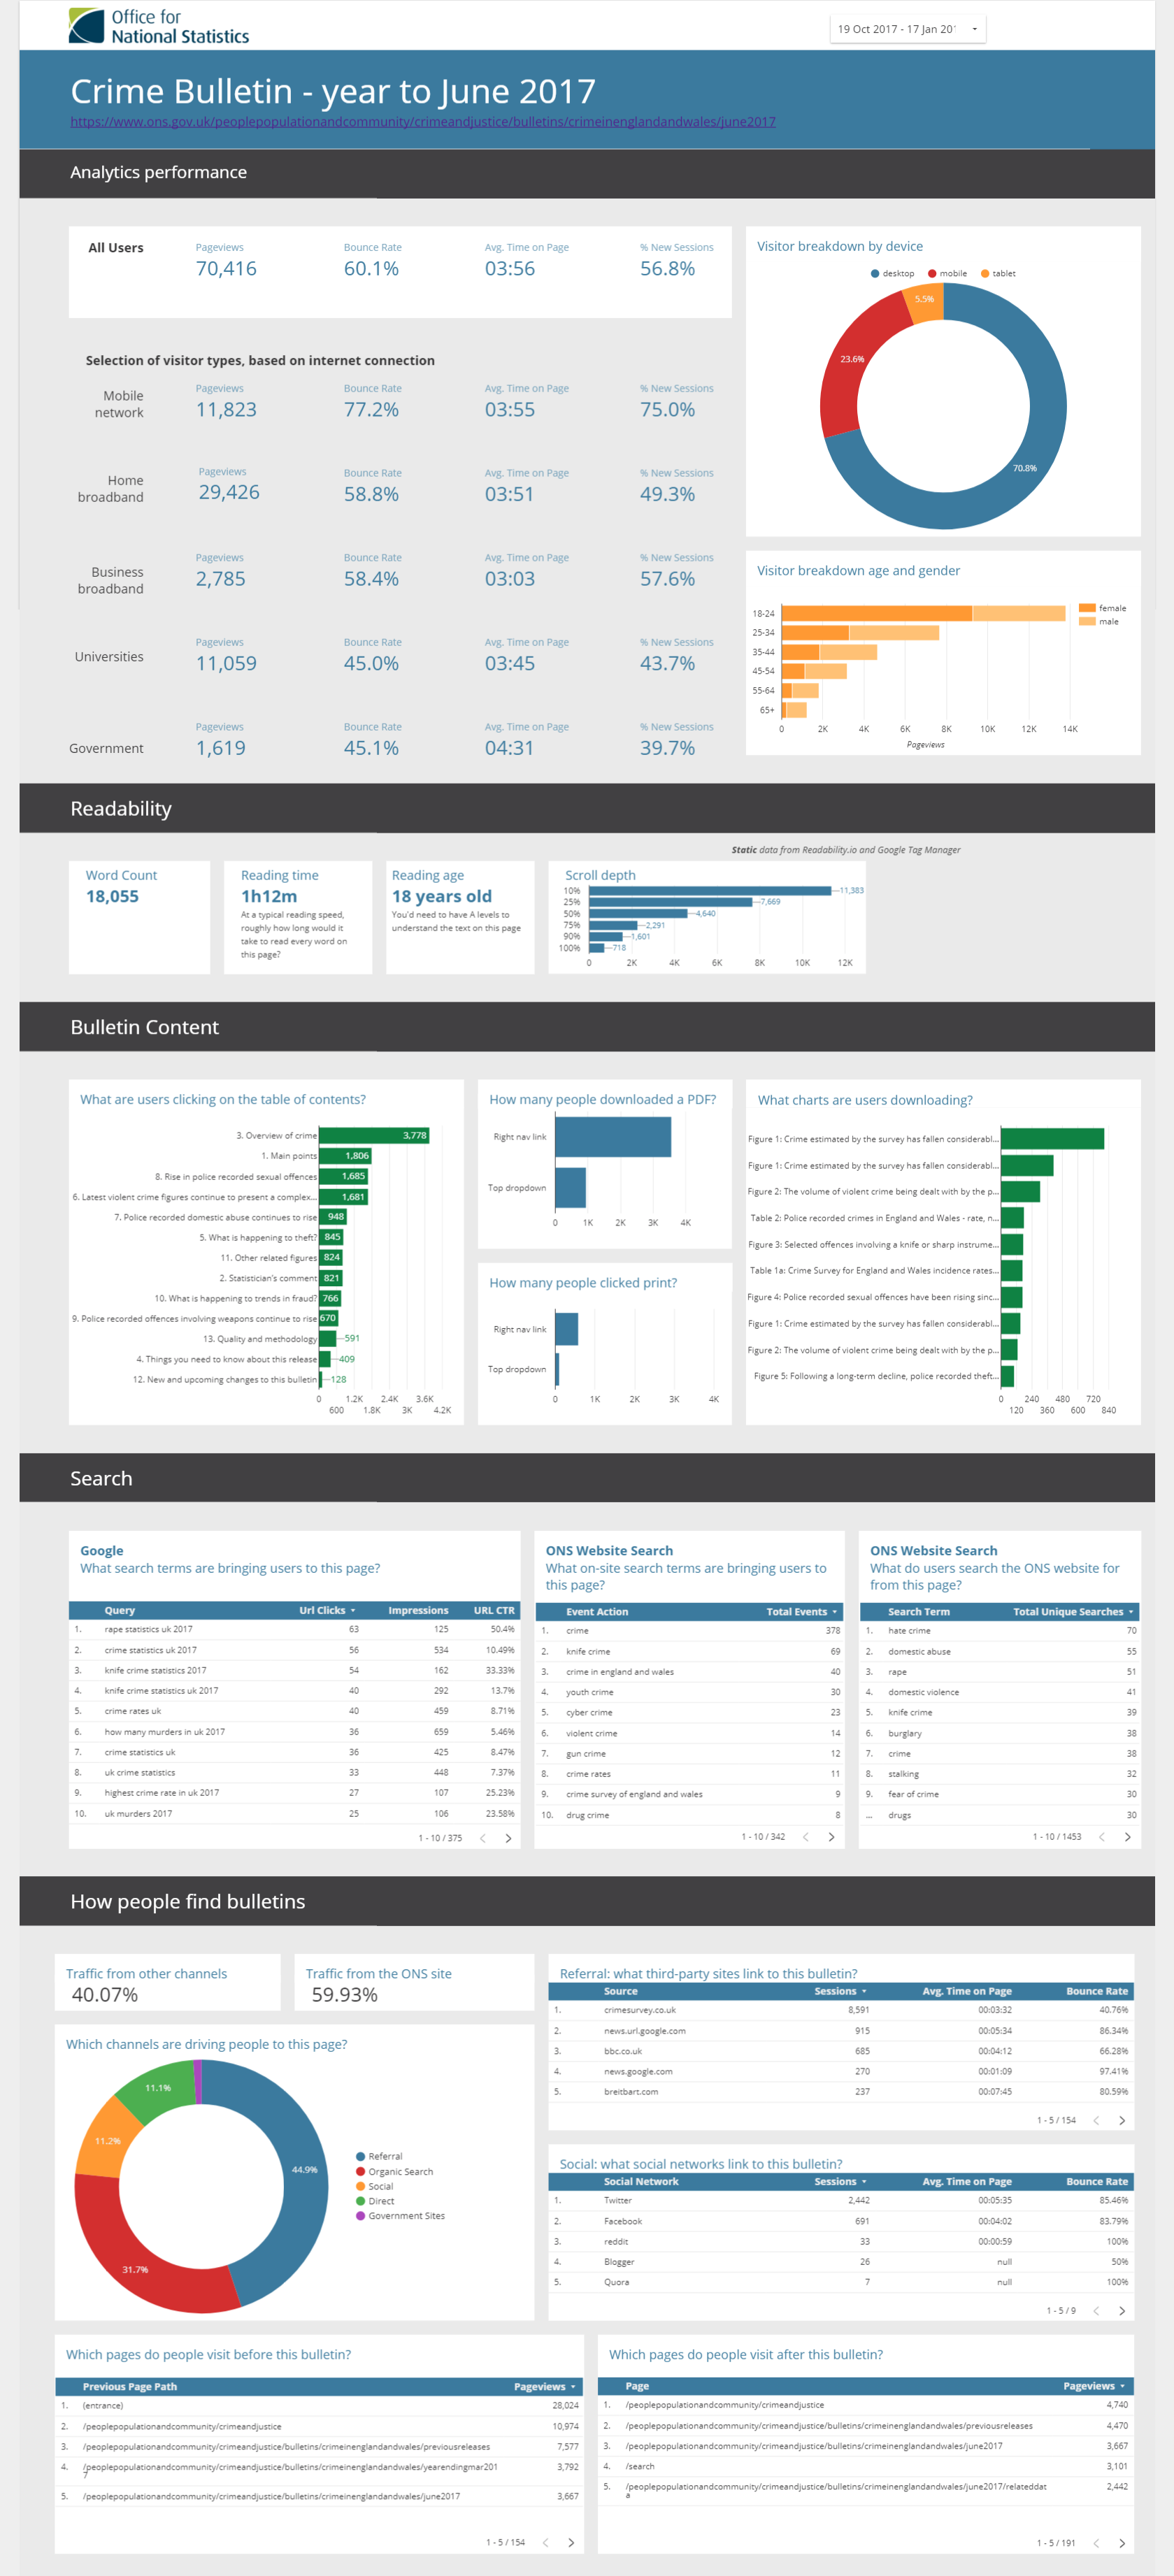
Here’s an example of a dashboard we’re using for content design.
The sections of the dashboard
The dashboard is broken into five sections.
Analytics performance
Cold, hard numbers! I wouldn’t recommend doing much on the strength of these statistics alone, but in combination, they can point to some interesting patterns. The dashboard shows:
- how many people are visiting this page (pageviews)? Do they stay on the page (bounce rate)? How long do they spend here (avg. time on page)? Are they new to the website (% new sessions)?
- a breakdown of visitors by the device they used, and by age and gender
- the number of users connecting via different internet service provider
We’re fortunate to have brilliant segmentation set up on our analytics account, which allows us to show these metrics broken down by internet service provider, which can be a loose indicator of their needs (are they connecting from home or work, for example – more on this in my next post).
Readability
We get the word count, reading time, and reading age from Readable.io or Hemingway. We have to enter this most of this data manually at the moment, as we can’t automatically pull it into the dashboard. These metrics are especially powerful when you look at the relationship between reading time and time on page (more on that in my next post). The dashboard includes:
- word count of the page
- reading time of the page content – based on the word count, how long would it take to read the entire page?
- reading age – based on the Flesch-Kincaid score (which takes into account the sentence length, word length, and syllables used), this tells us the level of education required to understand the text on the page
- scroll depth – not strictly a “readability” measure, but a useful indicator when viewed alongside reading time
Bulletin content
Again, we benefit from having fairly detailed tracking set up on our headings. This allows us to measure what people are choosing to do when they are on the page. This section covers:
- the most clicked headings in our table of contents
- the number of PDF downloads, “print this page” clicks, and chart downloads
Search
Search data is such a valuable source of information for content designers. It shows us the language our users have in mind when they visit the page. The number of times a term is used can also give us a sense of the popularity of specific topics covered in the content. The search section details:
- the most popular Google searches which led to this page (based on Google Search Console data)
- onsite searches which led users to this page
- onsite searches entered from this page
Right now, I’m trying to find a way to bring Google Trends data into this section to visualise popular related search terms.
How people find the page
The final section helps us understand where we fit into a user’s wider journey and the context within which they might land on the page. We look at:
- traffic which arrives at the page by navigating through the ONS site or other channels
- of the traffic that arrives via other channels, are they arriving via search, being referred from other sites, social media, or email?
- which sites and social media channels are referring the most traffic?
- and finally, which pages do people visit before and after landing on this page?
What to do with all this information?
There’s a lot of data here, enough to draw some helpful conclusions (and probably enough to draw so very unhelpful ones, too).
In my next post, I’ll explain how we’re using all this data, and what we’re planning to do next.