Five ways content designers are changing the ONS
ONS collects and publishes statistics about the economy, population and society. Our work informs decisions about everything from how the…
Read more on Five ways content designers are changing the ONSONS collects and publishes statistics about the economy, population and society. Our work informs decisions about everything from how the…
Read more on Five ways content designers are changing the ONSToday is World Product Day. This day raises awareness and appreciation for product management and the global tribe of product…
Read more on Happy World Product Day!It has been a little while since one of these, but I wanted to do any update on some of…
Read more on ONS website updates: 14 May 2019Yesterday morning, the Digital Women Wales network met at an event in Cardiff to talk about ‘A Woman’s Place is…
Read more on Nana’s New HipHave you ever wondered how a blind person reads their post? How someone with reduced mobility in their hands uses…
Read more on Making online questionnaires inclusive and accessible
NOTE: This study has now ended and we are no longer looking for recruits. Thanks to those who participated. This…
Read more on Help improve the way we ask questions in our surveysThe Office for National Statistics (ONS) is full of data, and full of people analysing it. But being a performance…
Read more on Performance analysts – what are they?Last week was my first week as Delivery Support Officer in the Digital Practice team. As we are all aware,…
Read more on My first week in Delivery Support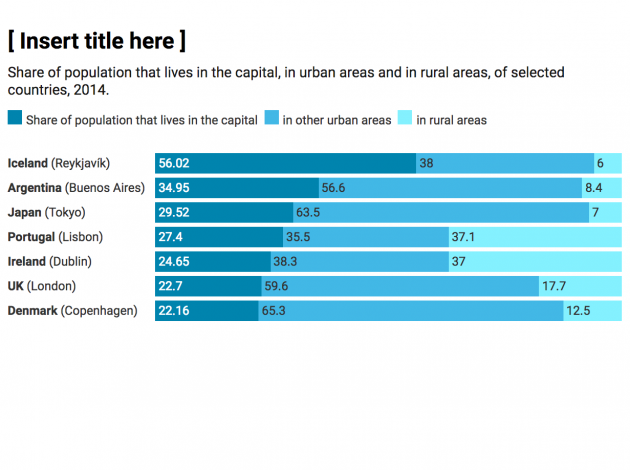
What’s the idea? Currently, most of the chart titles used across the ONS are purely statistical, signposting the data within…
Read more on Say what you see – the way we write chart titles is changingWhen I tell people I’m a Product Owner, I’m often met with confused faces and a few questions – “a…
Read more on What is a Product Owner?